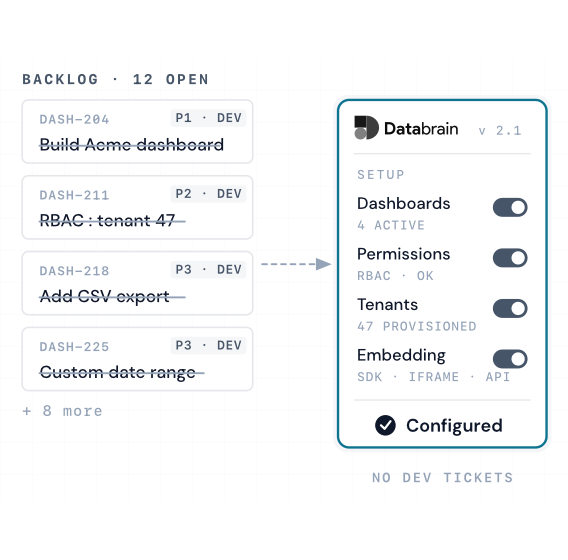
Ship without filing dev tickets.
Configure dashboards, permissions, and tenants through a no-code interface. Define each metric once and deploy it to every customer instantly.
EMBEDDED ANALYTICS PLATFORM
Ship customer-facing dashboards, AI-powered reports, and white-label analytics into your product in weeks, not months.
Flat pricing from $999/mo · No per-seat fees · 14-day free trial


We cut down on 6 months of work for our data analysts and saved around $300k by maintaining a smaller, more efficient team, avoiding the need to hire extra analysts just to handle ad-hoc reports.

Ajay
Chief Technology Officer, Spendflo
Case studyWe now offer our customers extensive insights out of the box, sparing them the pain of creating their own metrics, all while ensuring they have a seamless experience.

Jaskaran .B
Product Manager, SpotDraft
Case studyDatabrain allowed us to create a fully custom analytics module. Anybody in the org was now able to create metrics and share data with their tool.

Swami
Chief Product Officer, Freightify
Case studySwitching to Databrain streamlined everything with better customizations, predictable pricing and AI features that let our mortgage brokers get insights through natural language.

Evan
Co-founder, EpochOS
Case study


.webp)
Every product team eventually hits it. Customers want dashboards. Product wants to ship features. Engineering ends up building charts instead — for a year, and then forever.
You'll spend a year or more building what your customers already expect — while your core roadmap sits idle.
Paid to engineers who could've been building your product — all before a single dashboard reaches a customer.
Keeping queries, charts and dashboards running — permanently diverted from your competitive advantage.
Ship the same thing in 2–4 weeks, on flat-rate pricing.
Whether you're shipping the dashboard, building the embed, or approving the spend, DataBrain meets every team where the work actually happens.
Configure dashboards, permissions, and tenants through a no-code interface. Define each metric once and deploy it to every customer instantly.

React, Angular, and Vue SDKs alongside a REST API. Multi-tenancy and row-level security come standard. Let your team focus on the core product, not the dashboard beneath it.
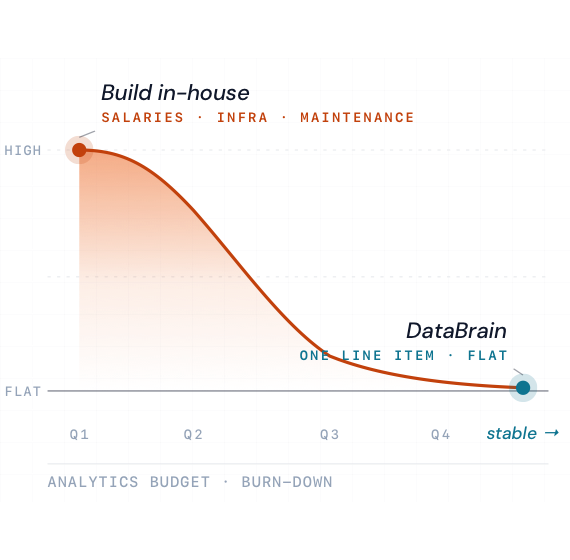
Replace unpredictable build costs with a single, predictable line item. Launch in weeks rather than quarters, and free your engineering team to focus on your core product.
Powering embedded analytics Software across industries
Core capabilities
One platform. Six capabilities. No BI expertise required, no plumbing to build.
Interactive Dashboard
40+ chart types. Drill-down, cross-filter, live data. Native to your product, not your vendor.

AI Copilot
Plain English in. Reasoning, schema, and real SQL out.
✦ Reasoning
✦ SQL Query
White Label Analytics
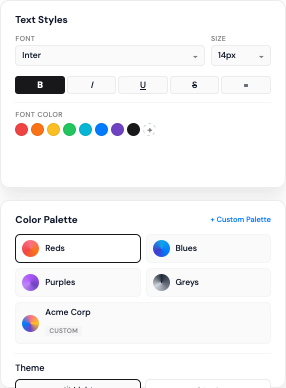
Customize colors, fonts, logos, and CSS. Customers never see DataBrain.
See white-label guide →
Flexible Embedding
Security
RLS · CLS · RBAC at query time.
View security model →Self-Service Reporting
Drag-and-drop builder. End-users compose, filter, and export without a single dev ticket.
How it works →
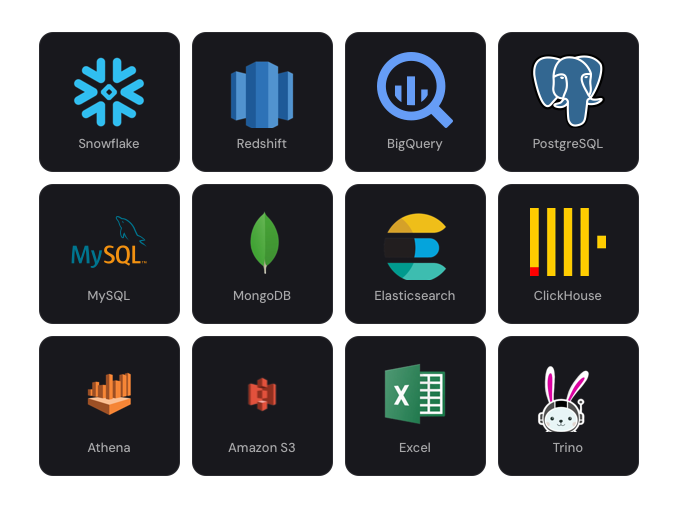
Plug into Snowflake, BigQuery, Redshift, PostgreSQL, MongoDB, and 15+ more. Real-time sync, zero migration, no ETL pipelines to maintain.
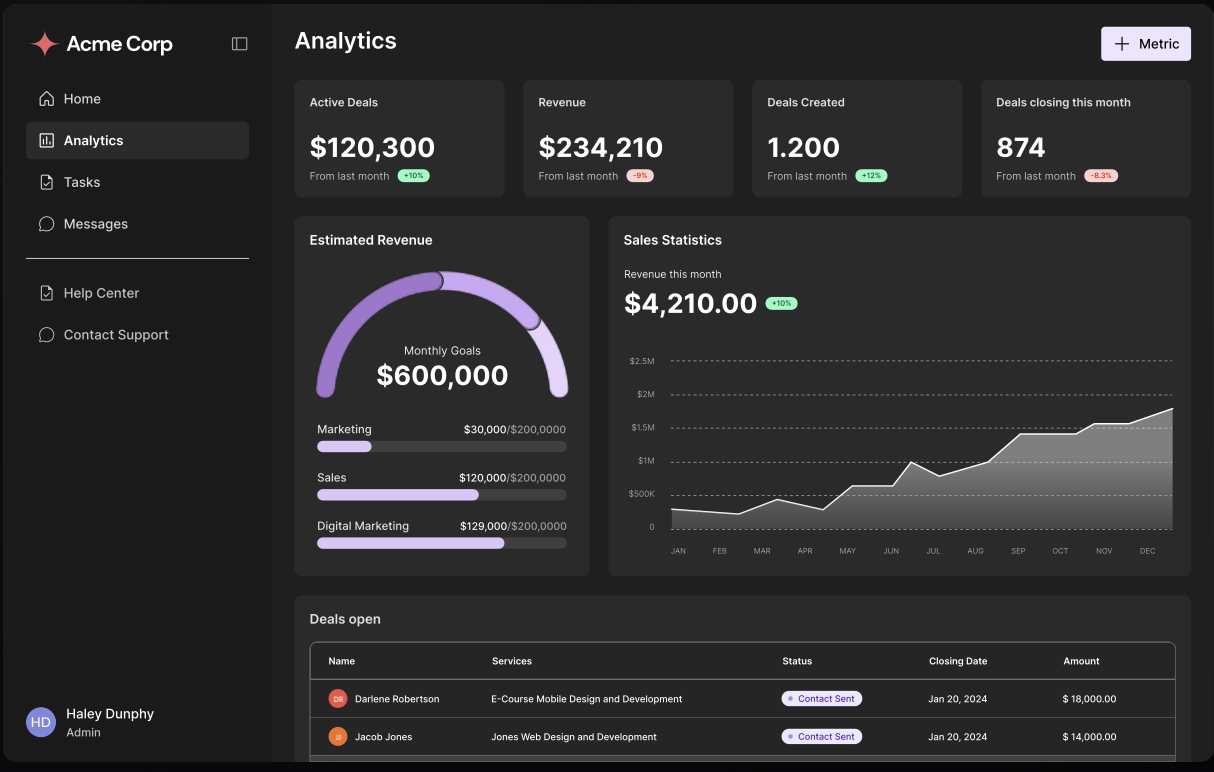
Design pixel-perfect dashboards with a drag-and-drop builder or developer SDK. 40+ chart types, AI-powered insights, and multi-tenant data isolation — fully themeable to your brand.

Embed customer-facing analytics in your product with React, Angular, Vue, Web Components, iFrame, or REST API. Multi-tenant secure and production-ready by default.

DASHBOARDS
50+ chart types, real-time data, drill-down, cross-filter. Customers never leave your app to get insights.

WHITE-LABEL
Custom color palettes, fonts, logos, full CSS control. Your users never know it's DataBrain powering their analytics.

AI ANALYTICS
Natural language queries, AI-generated reports, anomaly detection. Users ask in plain English — DataBrain answers in seconds.
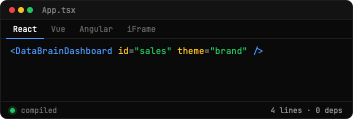
Three surfaces, one engine. DataBrain renders the same dashboard inside your app, on any webpage, or through your AI assistant. Pick the integration that fits your stack.
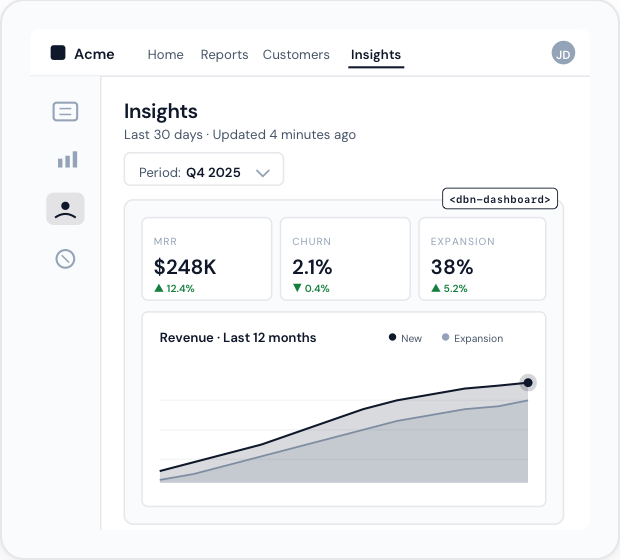
<dbn-dashboard token={…} />A single Web Components tag drops the dashboard into your React, Vue, Svelte, or plain-HTML app. Token-scoped, themeable, framework-agnostic.
View SDK docs →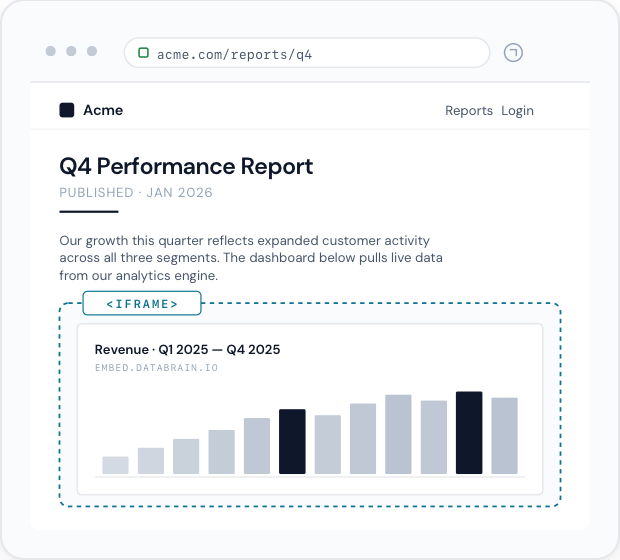
<iframe src="embed.databrain.io/…">One line of HTML, zero scripting. Ideal for landing pages, content management systems, and low-code platforms where you cannot run a build step.
See iframe guide →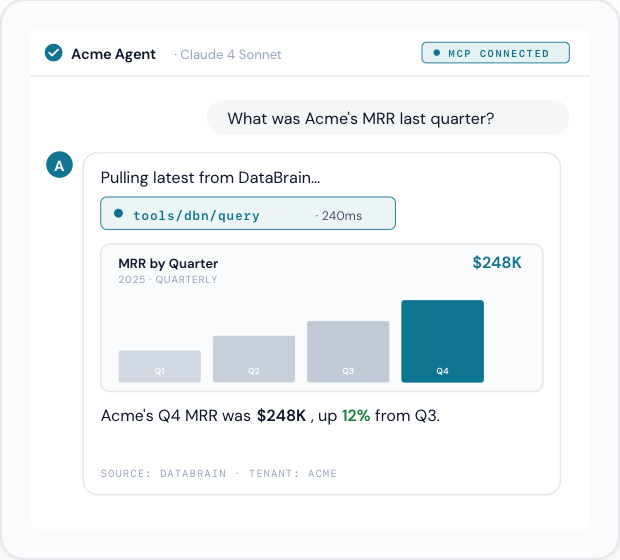
@databrainhq/mcp-serverConnect DataBrain as a tool source for Claude, GPT, or your custom agent. Tenant scoping and row-level security carry over, so the agent only sees what the requesting user is allowed to see.
Read MCP integration →BUILD VS BUY
The gap doesn’t show up until you’re already building.
Nothing hidden.
No multi-tenant security to build. No Infra to scale. No maintenance treadmill.
* Approximate first-year costs based on industry benchmarks. Run your scenario in our TCO calculator →
Everything your compliance team asks for — already shipped. No paid add-ons, no security tier upsell.


We cut down on 6 months of work for our data analysts and saved around $300k.
We now offer our customers extensive insights out of the box, sparing them pain.
Databrain allowed us to create a fully custom analytics module.
Switching to Databrain streamlined everything with better customizations and predictable pricing.
Everything teams ask before they ship embedded analytics.
Get it touch with us and see how Databrain can take your customer-facing analytics to the next level.
