

.png)
Most products already embed dashboards.
They look good in demos. They load quickly. They show the right numbers.
But once the product is in real use, something becomes clear: dashboards rarely influence what users do next.
Metrics are visible. Decisions still happen elsewhere. That's not a data issue. It's a product design issue.
When embedded analytics only reports outcomes, it becomes passive. When it allows users to explore, drill into detail, and act inside the product, it becomes part of the workflow.
This is the difference between embedded analytics that exist and embedded analytics that actually get used.
This article focuses on how to design embedded analytics that supports real decisions inside the product, not just reporting.
If you’re still evaluating what embedded analytics actually includes and the broader benefits of embedded analytics, start with this guide before you optimize for actionable outcomes.
A Common SaaS Scenario: Where Dashboards Lose Momentum
In many sales platforms, the dashboard does its job at first.
A manager can see total sales, region-wise performance, and high-level trends. Nothing looks broken. The numbers make sense.
The problem starts when they want to go one step further.
- Which regions are pulling results down?
- Is the issue concentrated in specific cities, segments, or reps?
- Are a few stalled deals skewing the numbers?
If answering those questions requires leaving the dashboard, the analysis usually stops.
Actionable setups handle this differently. Filters narrow the view without resetting context. Drill-downs expose where performance diverges. Drill-throughs connect summary metrics directly to deal-level data, where follow-ups actually happen.
Time controls make it possible to isolate seasonal effects instead of guessing from yearly trends. Rules reduce noise by hiding low-impact regions. Context like currency adjusts automatically based on what the user is viewing.
The key difference isn't the number of features. It's whether each interaction keeps the user moving forward.
The Shift From Visual Dashboards to Actionable Embedded Analytics
Visual dashboards answer one question well: What happened?
Actionable embedded analytics goes further. It helps users understand why something happened and what to do next without leaving the product.
As analytics becomes standard across SaaS products, differentiation comes from how quickly users can move from insight to action.
Drill-Down and Drill-Through: Two Different Jobs
Drill-down and drill-through solve different problems. Treating them as interchangeable usually leads to weak experiences.
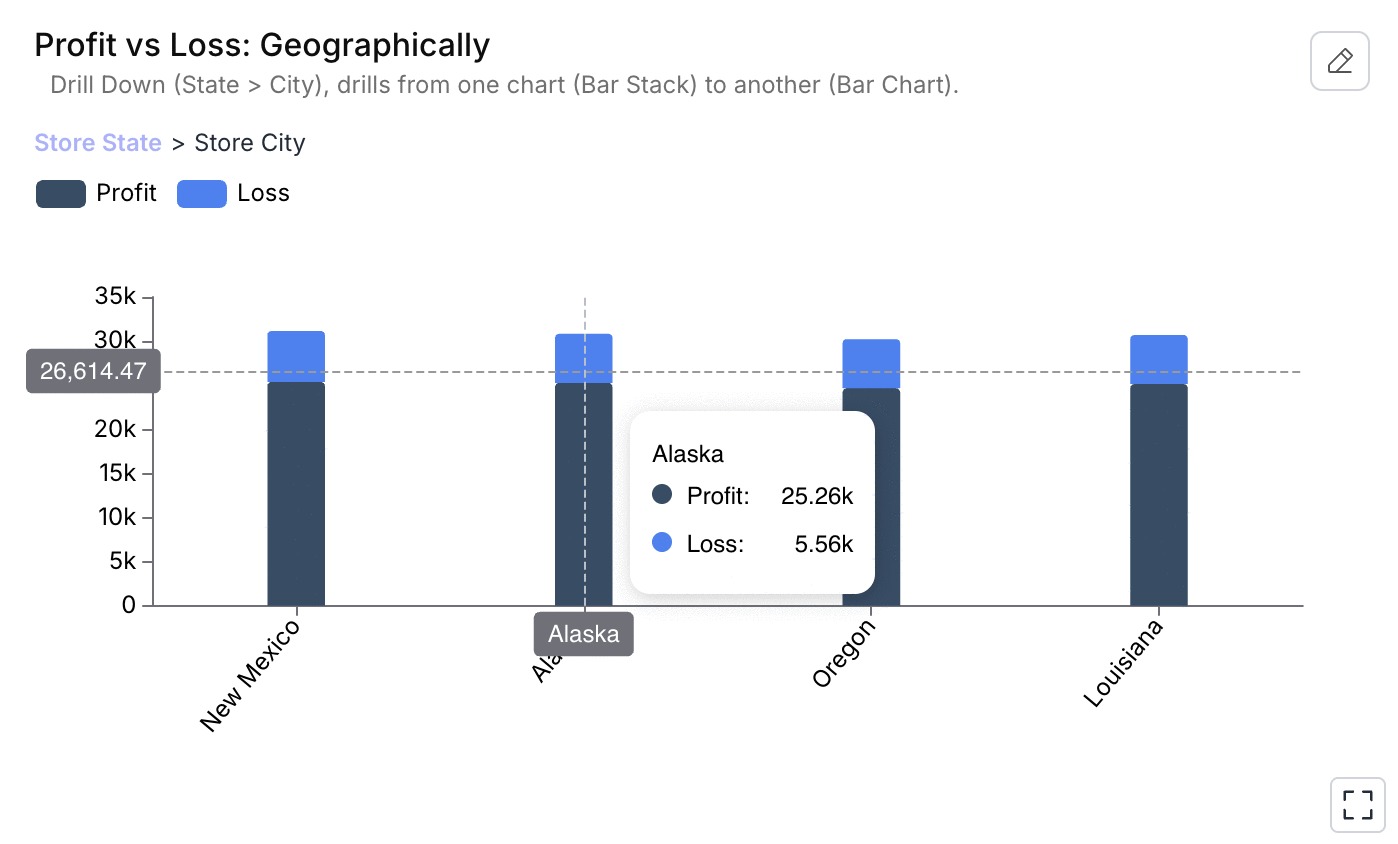
Drill-down: explaining change
Drill-down lets users navigate through hierarchical data inside a chart.
For example:
- Region → City
- City → sales rep
This helps users understand where performance is coming from while staying in context.
Drill-down is about explanation.
Drill-through: enabling action
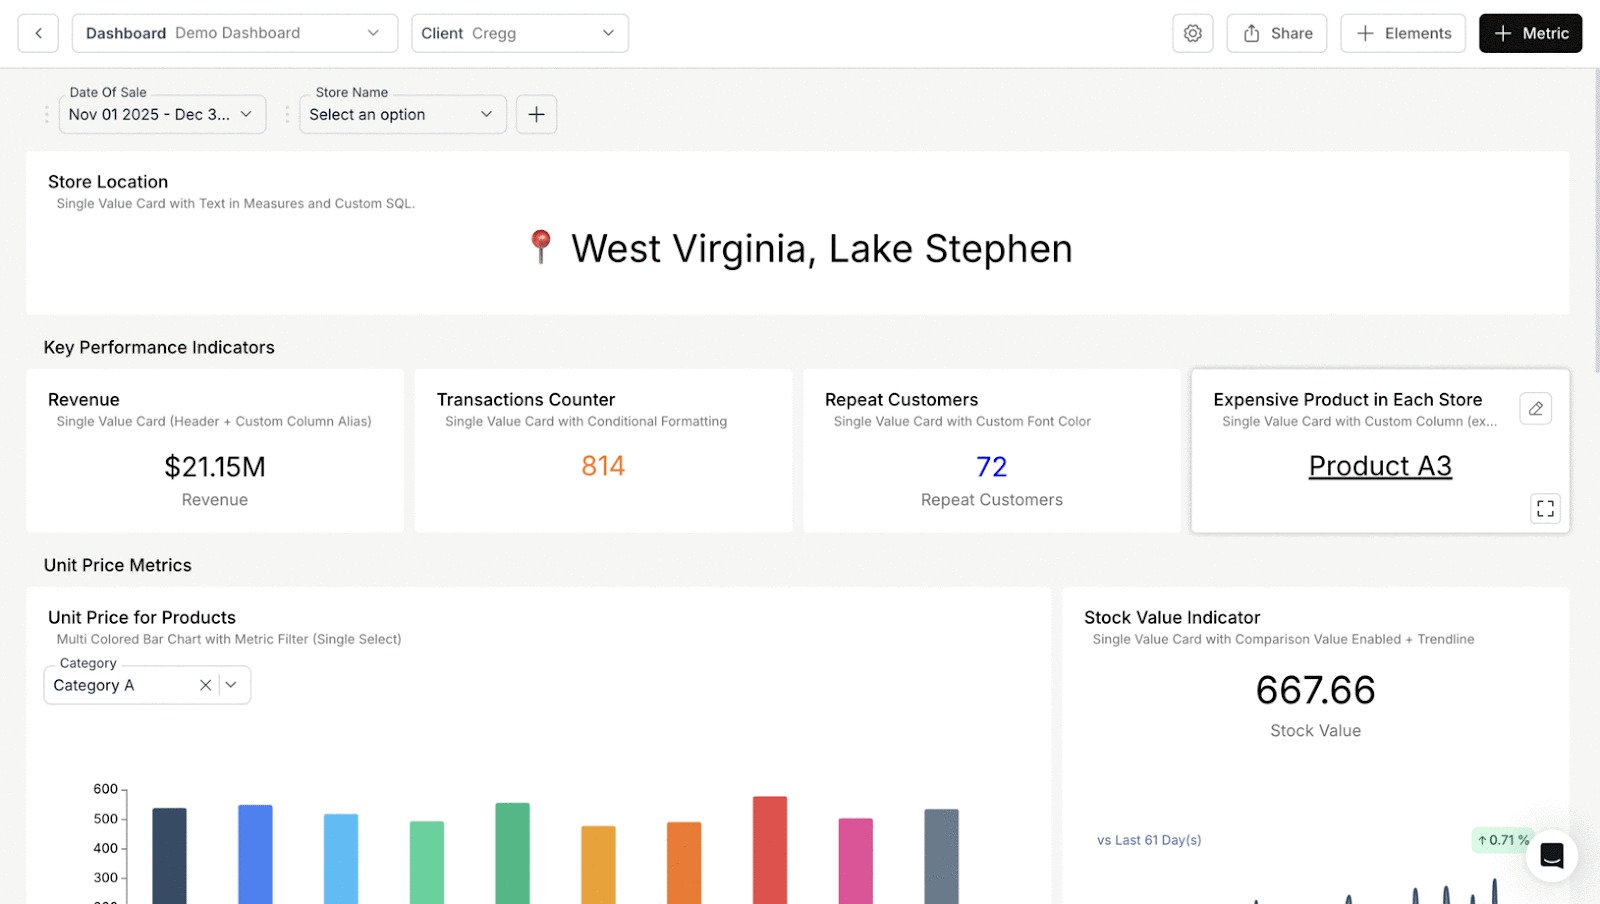
Drill-through takes users from a chart or KPI to the underlying records behind that number.
For example:
- Click a low win-rate KPI
- Open a deal-level table filtered to those losses
From there, users can act immediately.
Drill-through is about execution.
Drill-down vs Drill-through
Filters: Letting Users Ask Their Own Questions
Filters define how usable a dashboard is.
In Databrain, three filter types matter most:
- Dashboard filters to keep multiple charts in sync
- Metric filters for precise, logic-level constraints
- App-level filters to maintain context across dashboards
Together, these allow users to explore data freely without breaking flow or asking for new reports.
Cross-Dashboard Drill-Down: Navigating Between Dashboards
Cross-dashboard drill-down is not about continuing analysis on the same page.
It allows users to navigate from one dashboard to another based on the chart element they clicked.
For example:
- A user clicks a region in a summary dashboard
- They are taken to a different dashboard focused on that region
- Filters from the clicked value are passed automatically
This enables structured navigation between dashboards without manual filtering or reconfiguration.
Cross-dashboard drill-down is best used when:
- Dashboards serve distinct purposes
- Each dashboard is optimized for a specific level of detail
It's a navigation pattern, not just a continuation mechanism.
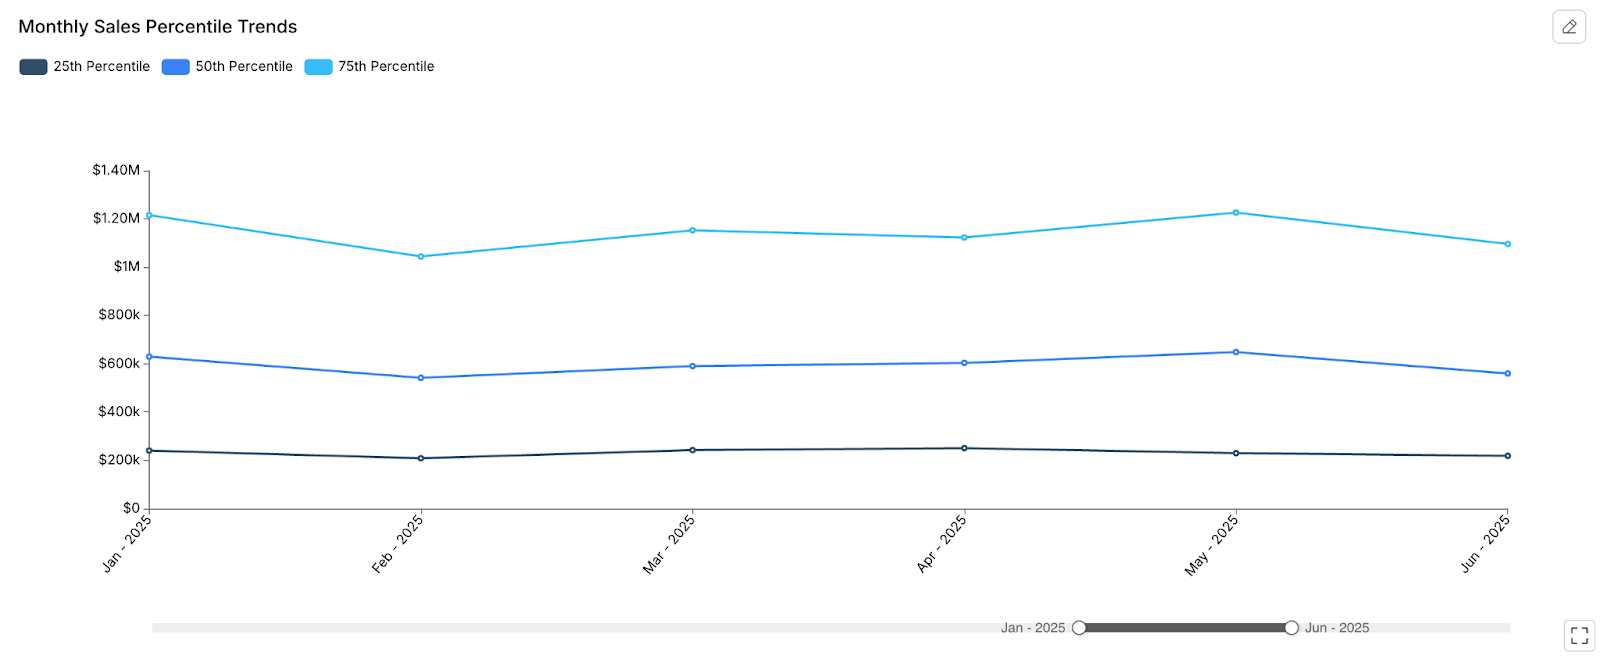
Zoom and Time Controls: Making Trends Usable
High-level time trends are useful for monitoring.
They're rarely enough for diagnosis.
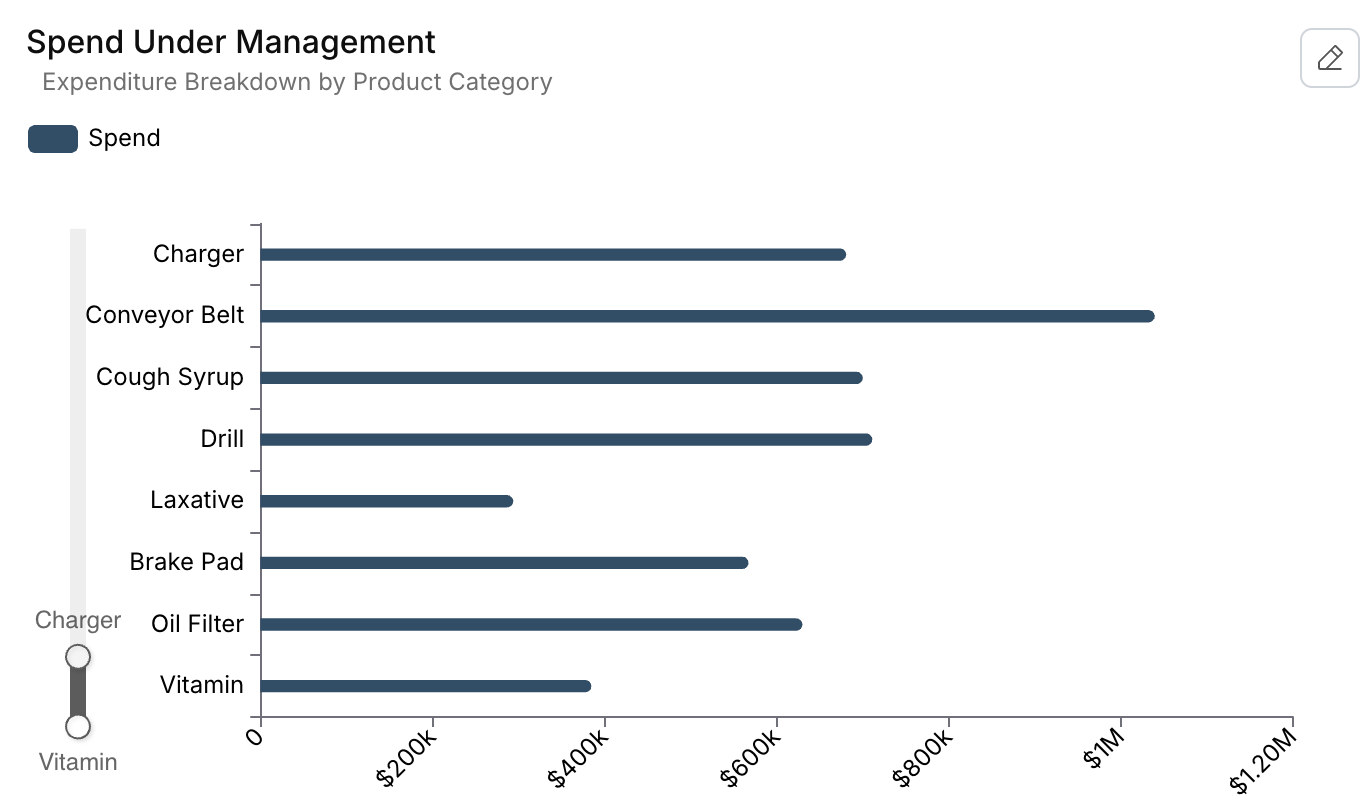
Zooming allows users to:
- Focus on specific time periods or segments
- Investigate seasonality
- Understand short-term anomalies
This turns time-series charts from passive summaries into analytical tools.
Rules Builder: Reducing Noise Automatically
Not all data deserves attention at all times.
Rules Builder allows dashboards to adapt by:
- Hiding metrics below thresholds
- Showing only high-impact regions or segments
- Guiding user focus automatically
This keeps dashboards clean and decision-oriented.
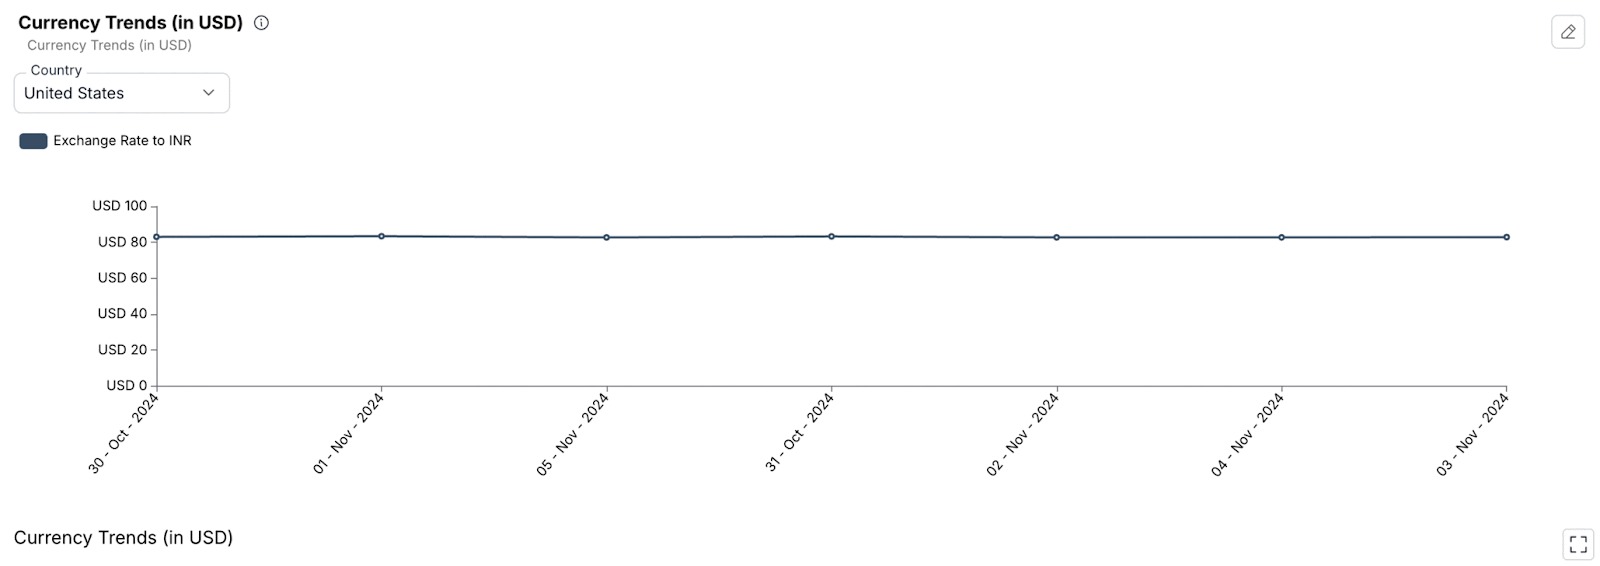
Dynamic Properties: One Dashboard, Many Contexts
Different regions use different currencies. Different roles care about different benchmarks.
Dynamic properties allow dashboards to adjust automatically based on context without duplicating dashboards. This is essential for scalable embedded analytics.
AI's Role in Actionable Embedded Analytics
AI enhances analytics by:
- Explaining changes
- Highlighting anomalies
- Suggesting next steps
It reduces the effort required to move from insight to decision.
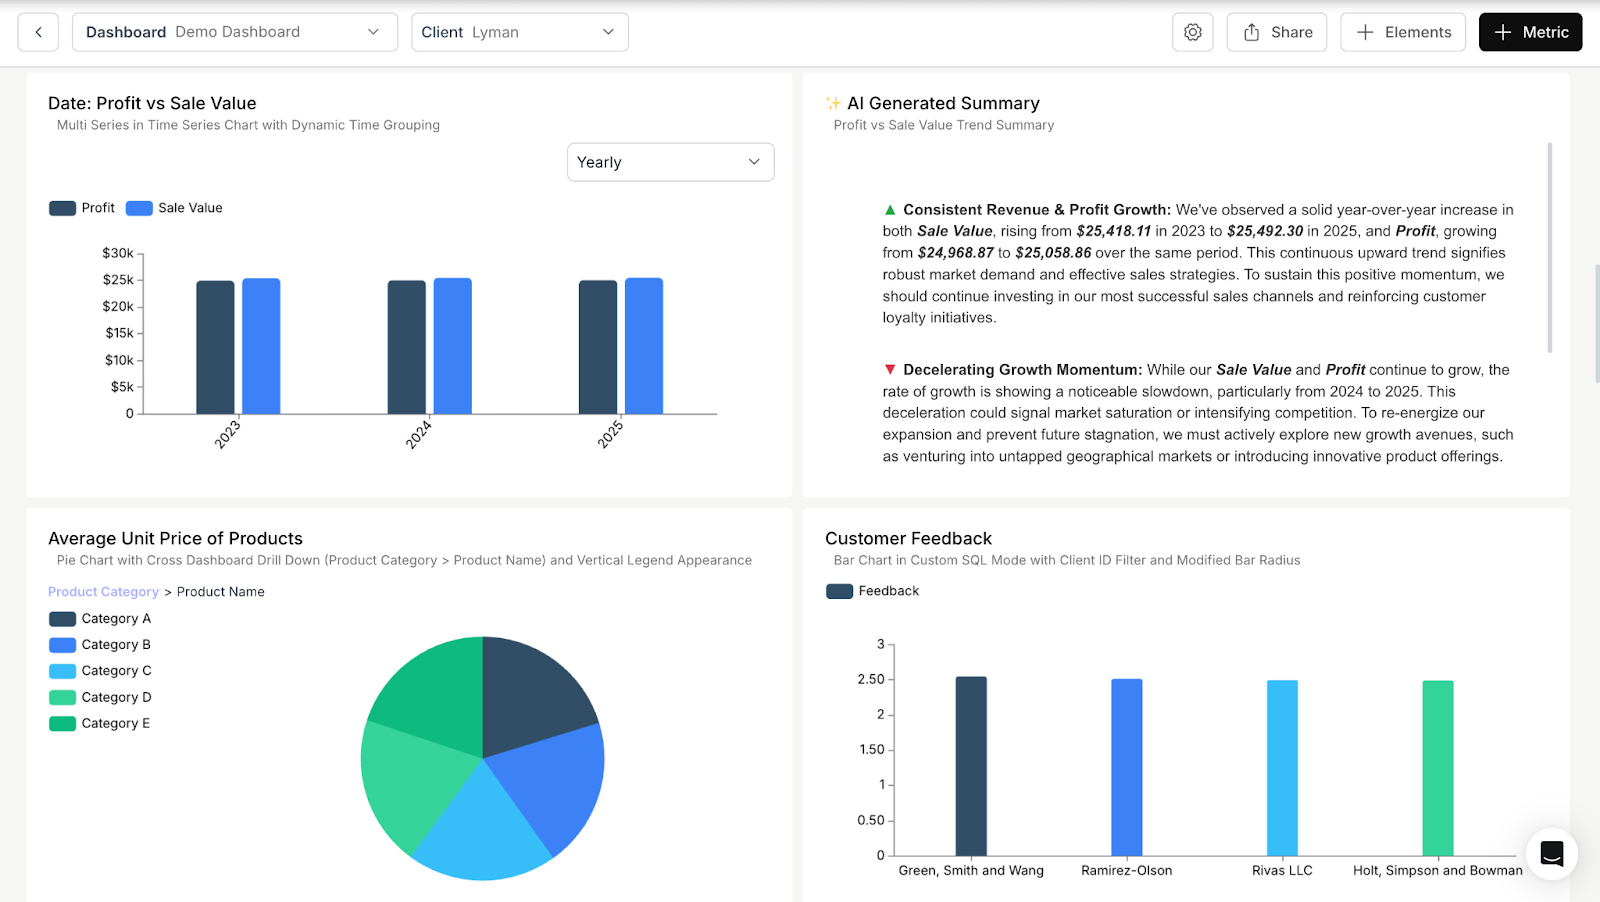
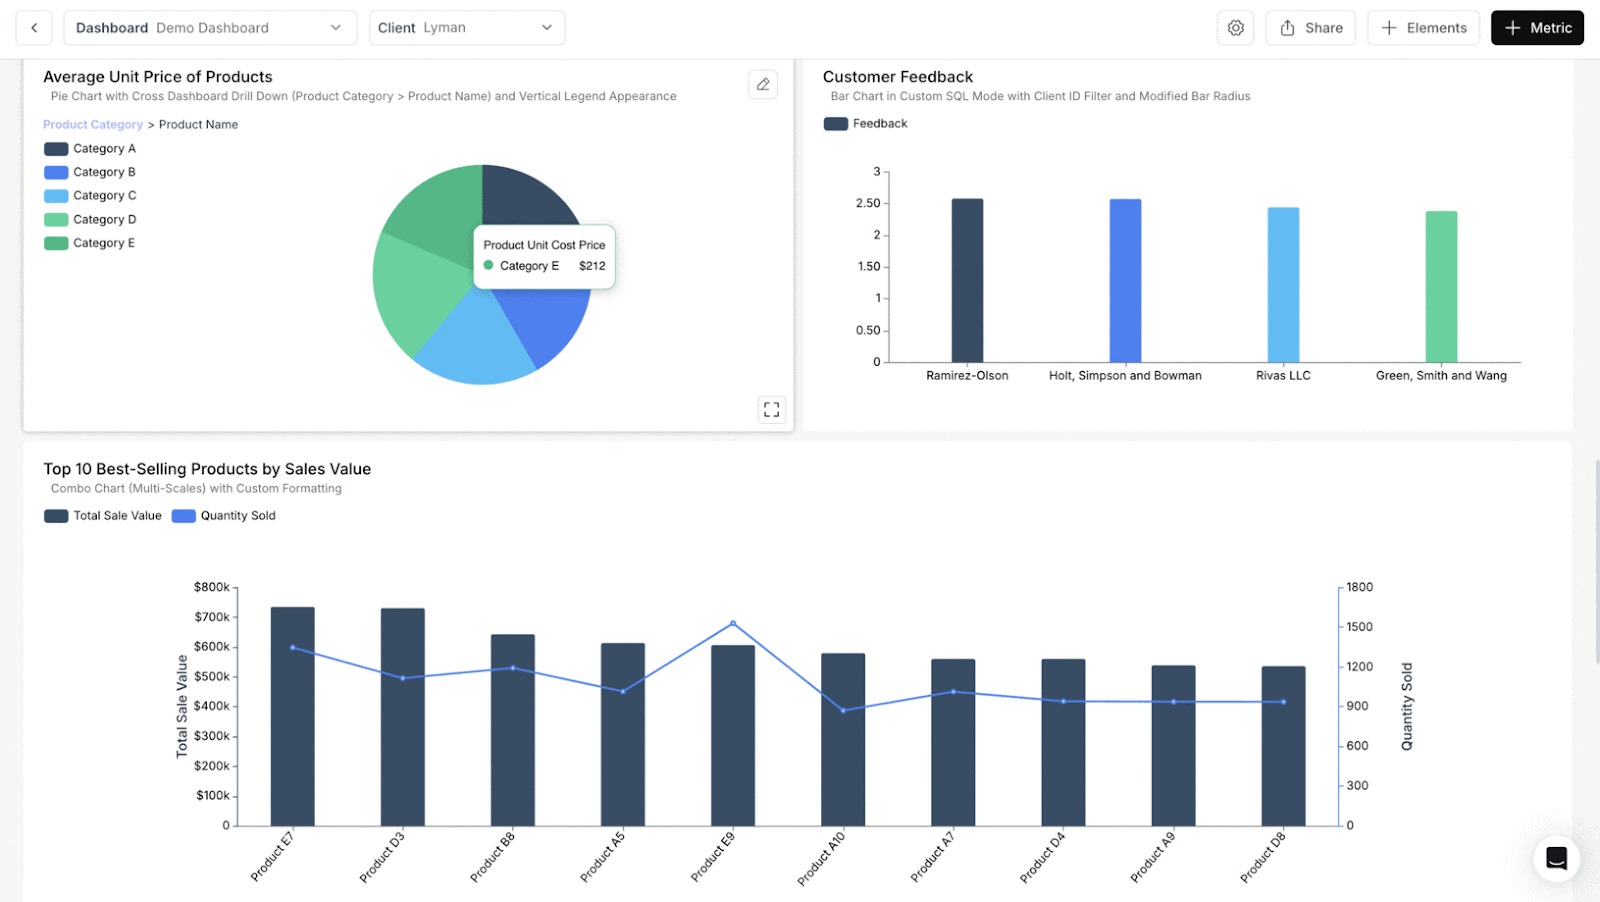
At the metric level, Metric Summary provides a concise explanation of how a specific metric is behaving.
In the example above, year-over-year changes in sales value and profit are summarized directly alongside the chart. Users get a clear description of growth patterns and shifts in momentum.
AI Insights looks across a metric to surface notable patterns.
Instead of scanning an entire dashboard, users see key observations called out explicitly such as consistent growth, slowing momentum, or emerging risks.
Click Actions: Connecting Insights to Workflows
Analytics should lead to action, not just awareness.
Click actions allow users to:
- Navigate to internal pages
- Open external tools
- Trigger context-specific actions
When users can act directly from analytics, dashboards stop being observational and start supporting real work.
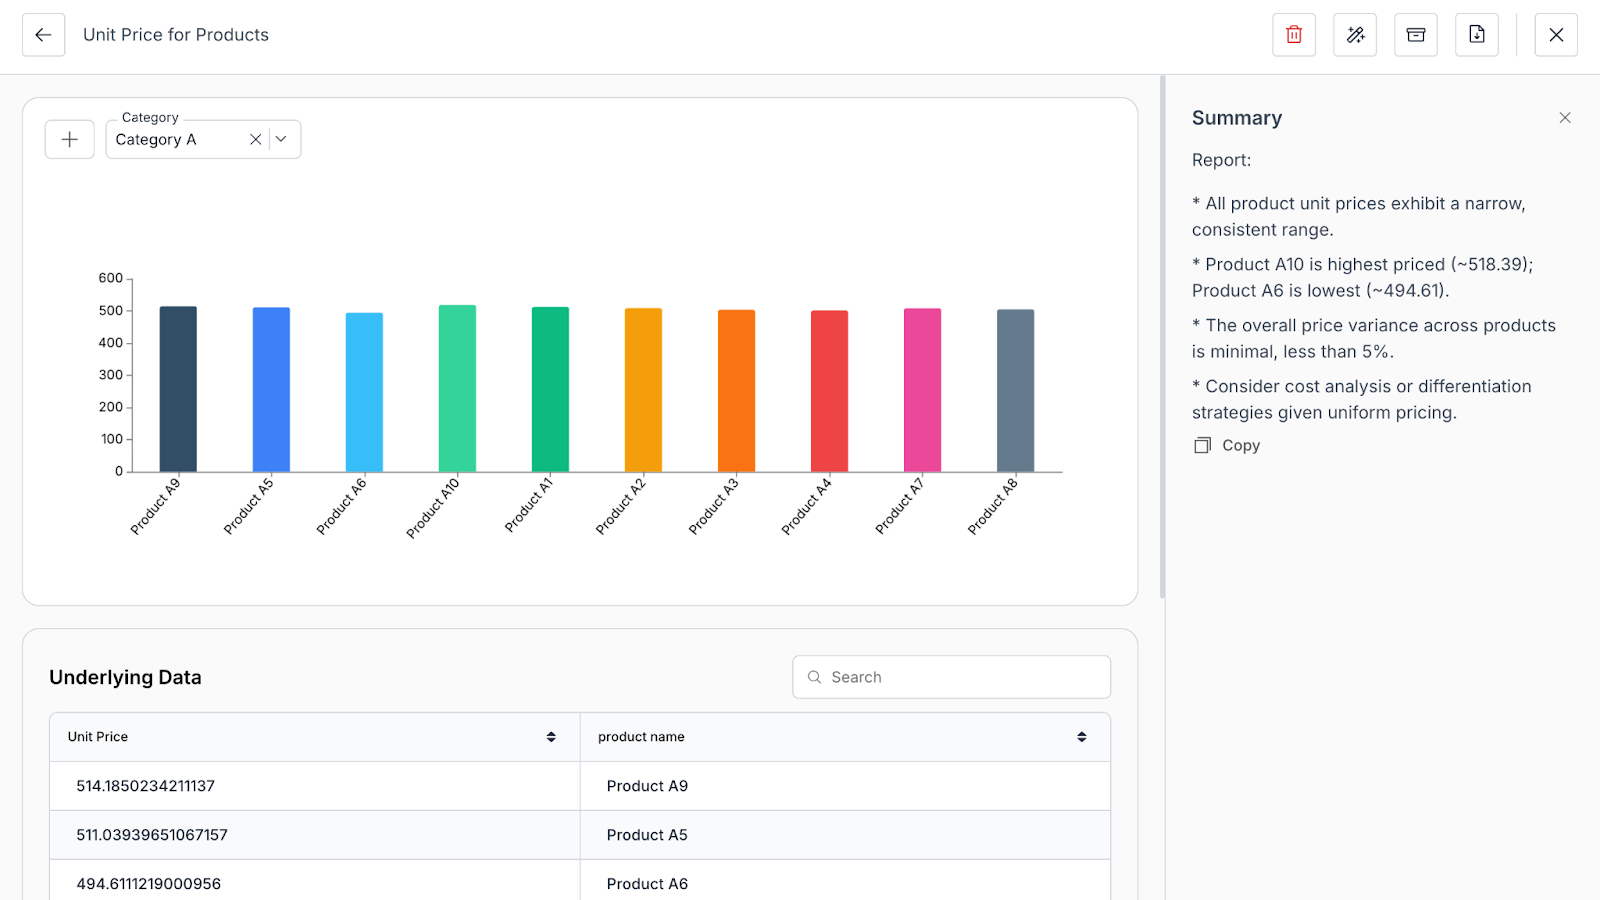
One-Click Downloads: Supporting Trust and Validation
Some users will always want to see the underlying data.
Supporting one-click downloads:
- Builds trust
- Reduces manual requests
- Supports offline analysis
When permissions are enforced automatically, governance stays intact.
End-User Customization: Supporting Different Roles
Light customization such as saving views or rearranging metric helps users focus on what matters to them without fragmenting dashboards. Flexibility, when controlled, increases long-term engagement.
What Actionable Embedded Analytics Looks Like in Practice
Actionable embedded analytics:
- Supports exploration
- Preserves context
- Enables follow-through
- Lives inside the workflow
How Databrain Makes Analytics Actionable
Databrain provides the building blocks required to move from static dashboards to in-product decision support:
- Dashboard filters for consistent slicing
- Metric filters for precise control
- App-level filters for shared context
- Drill-Down and Cross-Dashboard Drill-Down
- Drill-through via Chart Click Actions with Metric
- Rules Builder for conditional visibility
- Dynamic Property for contextual behavior
- Chart Zoom for focused analysis by narrowing visible category or spend ranges
- Click Actions for navigating to internal or external links
- Boards for organizing dashboards by role, category, or use case
- AI Insights
- Metric Summary for concise explanation of individual metric or group of metrics
- AI Summary for surfacing notable trends, changes, or anomalies in a metric
Together, these features allow teams to design analytics that stay interactive, contextual, and actionable without pushing complexity onto users or developers.
Closing Thought
Most products already embed dashboards. The difference is whether those dashboards influence what users do next.
Actionable embedded analytics closes the gap between insight and execution inside the product, at the moment decisions are made.
Build Analytics Users Actually Act On
If you're evaluating how to move from static dashboards to analytics users actually act on, Databrain enables that transition.
Book a Demo or Start a Free Trial to see how in-product analytics can support real decisions, not just reporting.


