

.png)
Why Your Embedded Analytics Stack Is Silently Failing and How Databrain Fixes It
The Problem You're Already Experiencing
Embedded analytics rarely fails loudly. Dashboards load. Charts render. Queries run.
Then real customers arrive. Latency creeps in. Data freshness degrades. Concurrent queries overwhelm the system. Your metrics no longer match across dashboards. Access controls are enforced inconsistently. Multiple teams quietly build separate dashboards for the same metric.
Database choice is only half the work; the embedded analytics delivery layer determines performance, tenancy isolation, and governance in the product.
By then, the damage is done: embedded analytics is now a product liability, not a feature.
This isn't a database problem anymore. It's a delivery problem. And you're fixing it the hard way with custom analytics backends, brittle embedding logic, and repeated infrastructure builds across teams.
You've already decided embedded analytics is non-negotiable for your product. You're past the "do we need this?" stage. You're in the "how do we build this right?" stage. You're evaluating databases, considering build-vs-buy for the analytics layer, and trying to figure out how to move fast without accumulating more tech debt.
This guide is written for engineering and product leaders who understand that databases and dashboards are only half the solution. The other half is the delivery layer that sits between them and is what determines whether embedded analytics succeeds or becomes a support nightmare.
The Hidden Cost: Why Database Choice Isn't Enough
Most teams approach embedded analytics like this:
- Pick a database (ClickHouse, PostgreSQL, Snowflake, etc.)
- Build dashboards on top of it
- Embed those dashboards in the app
- Ship it
By step 4, they discover three problems:
Problem 1: Database Performance Doesn't Equal Product Performance
A fast database doesn't automatically create a fast embedded analytics experience. You also need:
- Caching (so repeated queries don't hit the database every time)
- Pre-aggregation (so common calculations aren't recalculated for every user)
- Query optimization (so complex queries get rewritten into fast ones)
- Concurrency management (so 500 concurrent users don't collapse the system)
Most teams build this themselves. Most regret it.
Problem 2: Governance and Access Control Collapse
Embedding analytics means exposing data to your users.
Which means you need:
- Multi-tenant isolation (tenant A can't see tenant B's data)
- Row-level security (user X can only see their own records)
- Audit trails (compliance requires knowing who saw what and when)
- Consistent metrics (the revenue metric in dashboard 1 must equal the revenue metric in dashboard 2)
If you wire dashboards directly to databases, you're spreading access control logic across dashboards, backend APIs, and database views. Inevitably, they drift. Security gaps open. Metrics diverge.
Problem 3: Embedding is Harder Than It Looks
"Just embed a dashboard in our app" sounds simple.
It's not.
You need:
- Secure Credential Management (users shouldn't see database credentials)
- Session Handling (embedded dashboards need secure user context)
- Filter Propagation (filters in the app should flow to the dashboard)
- Multi - Tenancy at the UI level (different customers see different data)
- Performance Monitoring (you need to know when embedded dashboards get slow)
If you build this with open-source BI tools or raw API calls, you've just built a custom analytics backend. You own the bugs. You own the scaling. You own the maintenance.
The Real Problem: You Need a Delivery Layer, Not Just a Database
Here's what actually matters for embedded analytics success:
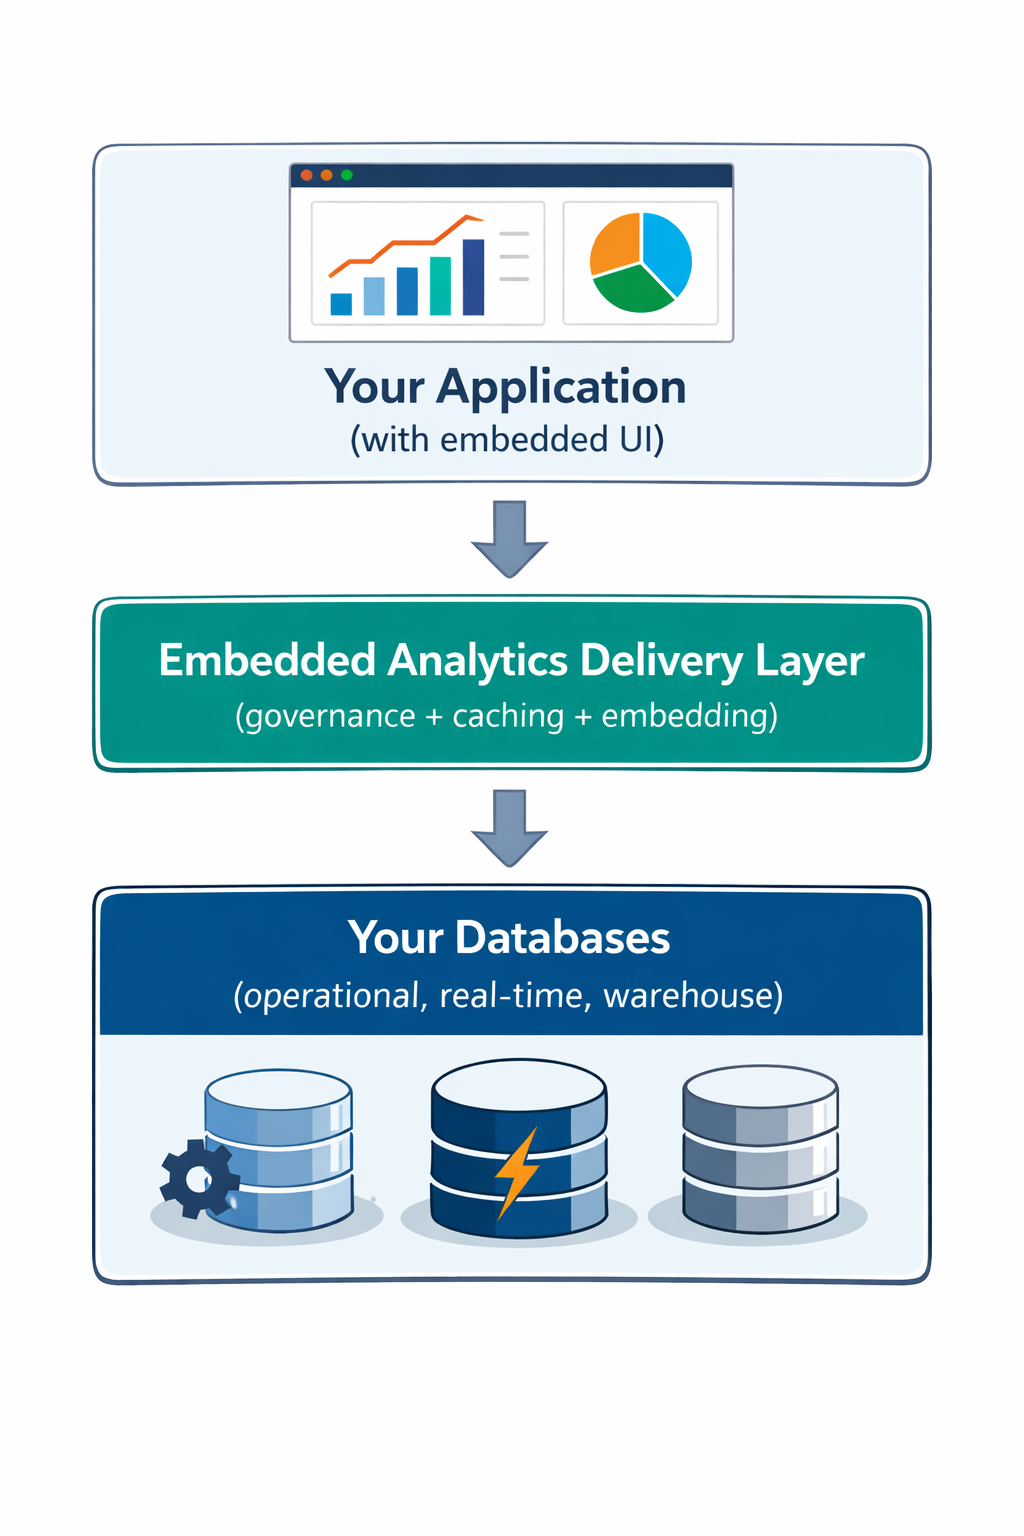
Databrain is the delivery layer.
It sits between your databases and your embedded dashboards, handling:
- Metric Definitions and Consistency
- Access Control and Multi - Tenancy
- Caching and Query Optimization
- Embedding SDKs and Secure Sessions
- Performance Monitoring and Alerting
Database Categories for Embedded Analytics: Choose the Right One
Different databases have different strengths. No single database wins across all dimensions for embedded analytics. Real products almost always use multiple systems.
The risk is exposing those systems directly to customers.
Traditional / Operational Databases
Examples: PostgreSQL, MySQL, MongoDB
Why teams start here:
- Already power the core application
- Strong transactional guarantees
- Minimal infrastructure changes
Where they break:
- 30-50 concurrent dashboard users
- Interactive Aggregations over tens of millions of rows
- Mixed transactional + analytical workloads
The biggest risk isn't slow dashboards. It is analytics queries impacting application performance. Your ops team pages you at 2 AM because a customer's dashboard query locked critical tables.
The Databrain advantage: Databrain allows teams to expose analytics from operational databases safely by:
- Defining consistent metrics and dimensions
- Enforcing tenant-level data access
- Embedding dashboards without exposing raw queries or database credentials.
Real-Time & HTAP (Hybrid Transactional / Analytical Processing) Analytics Databases
Examples: ClickHouse, SingleStore
Why teams adopt them:
- Sub-100 ms query latency (sometimes <10 ms)
- High ingestion throughput (millions of events/sec)
- Designed for concurrent analytical workloads
These systems excel when:
- Dashboards must feel instantaneous
- Event volumes are high
- Many users query the same metrics
Trade-offs:
- Operational complexity (schema design, cluster management)
- Steep learning curve
- Dedicated infrastructure ownership
The Databrain advantage: Databrain sits on top of real-time analytics databases as the embedded analytics layer, allowing teams to:
- Model metrics once
- Govern access across tenants
- Embed dashboards without custom analytics APIs
Distributed SQL (NewSQL) Databases
Examples: CockroachDB, YugabyteDB
Why teams choose them:
- Horizontal scalability
- Strong consistency across regions
- Familiar SQL interface
Why they're not ideal for embedded analytics:
- Row-oriented storage (slow for aggregations)
- Analytics workloads compete with transactions
- Expensive to scale for high concurrency
Typical pattern: These work best as systems of record. Offload analytics to specialized databases and expose them through an embedded analytics layer.
Distributed SQL Query Engines
Examples: Trino, Amazon Athena
Why teams try them:
- Query across multiple systems
- Pay-per-query pricing
- Minimal infrastructure
Why they fail for embedded analytics:
- Unpredictable latency (queries can take 5-30 seconds)
- Poor concurrency handling
- Limited tuning control
Better for: Exploratory analysis and internal dashboards, not customer-facing embedded dashboards.
Search Engines
Examples: ElasticSearch, OpenSearch
Strengths:
- Text search and filtering
- Log and event search
- Flexible schema
Common mistake: Using them as general-purpose analytics backends.
Reality: Search engines are often expensive at scale and complex to tune for numerical aggregations. Some teams use them for analytics. Most regret it later.
Head-to-Head: Real-Time Analytics Databases for Embedded Dashboards
If you're building embedded analytics with serious performance requirements, you're likely evaluating real-time analytics databases.
Reality check: These databases solve query performance. They don't solve embedding, governance, or operational burden. You still need to build (or buy) the delivery layer.
This is where teams stall. Choosing ClickHouse is the easy part. Building secure multi-tenant embedding on top of ClickHouse takes months.
Three Real Scenarios: Where Teams Get Stuck
Scenario 1: PostgreSQL (or MySQL) Embedded Analytics
The situation: Your operational database is PostgreSQL. You need embedded dashboards. You decide to query Postgres directly (or through a lightweight analytics layer).
What happens:
- Dashboards work fine for the first 10 customers
- At customer 50, you notice Postgres is slow
- At customer 150, your app slows down as analytics queries start blocking OLTP queries and users get frustrated, leading to churn
- At customer 300, you need a complete rewrite
- You spend 3 months migrating to ClickHouse while your analytics feature stalls
With Databrain: Analytics can be embedded cleanly and governed correctly while teams plan their next database move.
Scenario 2: ClickHouse Without a Delivery Layer
The situation: You migrate to ClickHouse for performance. Dashboards are now fast.
What happens:
- Three teams build separate analytics layers on top of ClickHouse
- The "revenue" metric is calculated differently in each
- Row-level security is implemented inconsistently
- When GDPR delete requests come in, you have to manually scrub three different analytics systems
- You've solved performance. You've created a governance nightmare
With Databrain: ClickHouse becomes a backend system, while Databrain handles embedding, permissions, and metric definitions.
Scenario 3: Multiple Systems, No Delivery Layer
The situation: You have an operational database, a real-time analytics database, a warehouse, and a search engine. Each is wired separately to dashboards.
What happens:
- Customer data appears in one dashboard but not another (different query logic)
- A data retention policy change requires updates in four different places
- The "weekly active users" metric is 10% higher in one dashboard than another
- Your analytics are brittle and unmaintainable
With Databrain: One delivery layer. One source of truth for metrics. One place to enforce access control. One embedded analytics layer across systems, without custom backend glue. Dashboards stay consistent across all underlying databases.
Decision Framework: Choose Your Database in Three Steps
Step 1: Define Latency Requirements
Under real user concurrency, if embedded dashboards must respond in <200 ms under concurrent usage, operational databases alone won't work.
If you can tolerate 500 ms to 2 seconds, a warehouse with smart caching might work.
If you need <100 ms, you need a real-time analytics database.
Step 2: Estimate Query Volume & Concurrency
Multiply:
- Users per tenant
- Dashboards per user
- Charts per dashboard
- Refresh frequency (manual click vs. auto-refresh)
Example: 500 users × 3 dashboards × 4 charts × 2 refreshes per minute = 12,000 queries/minute peak.
At 200 queries per second concurrent, most operational databases collapse.
Step 3: Add a Delivery Layer (This Is Non-Negotiable)
Don't wire dashboards directly to databases.
Use a delivery layer that:
- Handles caching and query optimization
- Enforces access control and multi-tenancy
- Provides embedding SDKs and secure sessions
- Monitors performance and alerts on degradation
This is where Databrain comes in.
Why Databrain: The Embedded Analytics Delivery Layer You Need
Databrain is not a database. It's the system that makes your databases work safely, consistently, and reliably for embedded analytics.
What Databrain Does
1. Metric Definition & Consistency
Define revenue, active users, retention, churn once. Every dashboard uses the same logic. No divergence.
2. Multi-Tenancy & Access Control
Customer A sees only their data. Customer B sees only their data. Row-level security is enforced at the query layer, not the dashboard layer.
3. Embedding SDKs
Embed dashboards in your app in minutes, not weeks. Secure sessions. Filter propagation. Credential isolation. It just works.
4. Database Agnosticism
Works with PostgreSQL, ClickHouse, Snowflake, BigQuery, and more.
References on how to connect to data sources using Databrain:
- Traditional / Operational Databases: MySQL,Microsoft SQL Server (MSSQL), PostgreSQL, MongoDB
- Real-Time & HTAP Analytics Databases: ClickHouse, SingleStore
- Distributed SQL & Query Engines: Trino, Amazon Athena
- Search, Storage & Analytics Engines: OpenSearch, ElasticSearch, Amazon S3
What Databrain Enables
- Faster embedded analytics launches: Ship dashboards in weeks, not months.
- Safer deployments: Multi-tenancy and access control are built-in, not retrofitted.
- Operational simplicity: One place (workspace) to manage metrics, security, and performance
- Easier scale: Add more users, more dashboards, more customers. Databrain manages concurrency and optimization.
The Path Forward: Three Options
Option 1: Continue Building Yourself
- Timeline: 9–12 months to feature parity
- Cost: $300K–500K upfront
- Risk: Security gaps, performance issues, ongoing maintenance burden
- Outcome: You own every bug
Option 2: Use Open-Source BI Tools + Custom Backend
- Timeline: 4–6 months (still significant)
- Cost: $100K–200K upfront
- Risk: Brittle embedding, governance gaps
- Outcome: You own the integration layer and all its problems
Option 3: Databrain
- Timeline: Weeks to deploy, not months
- Cost: Flat-rate pricing means one predictable monthly cost, regardless of users or embeds.
- Risk: Minimal (multi-tenancy and security are battle-tested)
- Outcome: Focus on your product, not infrastructure
What Happens Next: The Databrain Evaluation
Ready to stop building embedded analytics infrastructure and start embedding dashboards and shipping features?
Step 1: Architecture Review (30 minutes)
Discover how Databrain integrates analytics directly into your product through interactive dashboards, self-service reporting, and AI-driven insights.
Our product experts will review your current setup and walk you through a live demo while answering technical questions in real time. Together, we'll identify:
- Database and performance bottlenecks impacting analytics
- Governance and access control gaps
- Challenges with embedding and customization
- Opportunities to reduce costs and improve scalability
You'll also see real-world examples of how teams use Databrain to increase user engagement, improve retention, and unlock new revenue streams through embedded analytics.
Step 2: Proof of Concept (1-2 weeks)
Connect your own data. Build a sample dashboard. See embedded analytics working in your environment.
Step 3: Guided Trial (14 days)
Ship your first production dashboard with Databrain.
Step 4: Scale (Ongoing)
Add more dashboards, more users, more customers. Databrain scales with you.
Your Next Move
Option 1: 30 Min Architecture Review
- Review your current embedded analytics setup
- Identify bottlenecks and optimization opportunities
- See how Databrain enables interactive, self-service analytics
- No commitment required
Option 2: Guided Product Trial
- Connect your own data
- Build a dashboard end-to-end
- See Databrain in action
The Bottom Line
Embedded analytics doesn't fail because you picked the wrong database. It fails because you tried to solve database performance, governance, and embedding all at once, without the right delivery layer. Database choice matters. So does caching, multi-tenancy, secure embedding, and performance monitoring.
Databrain handles the delivery layer so you can focus on your product. Choose your database. Use Databrain. Ship embedded analytics that work.
Questions? Ready to evaluate Databrain?
Schedule an architecture review
What's Next: Cloud Data Warehouses and Embedded Analytics
Snowflake, BigQuery, Databricks, and Firebolt are increasingly evaluated for embedded analytics, sometimes as the primary backend, sometimes alongside real-time systems.
In Part 2, we break down:
- When modern cloud data warehouses make sense for embedded analytics
- Where they introduce latency, cost, and concurrency risks
- How to use them safely without exposing warehouse complexity to your product
Frequently Asked Questions
Can I use PostgreSQL or MySQL for embedded analytics?
You can start with them, especially for low data volume and limited users. But as usage grows, you’ll hit constraints around concurrency, query latency, and mixed workloads. They work best as a stepping stone, not a long-term backend for analytics-heavy product features.
What is OLTP vs OLAP in embedded analytics?
OLTP (Online Transaction Processing) systems handle application operations (writes, updates, point reads). OLAP (Online Analytical Processing) systems handle analytics (aggregations, scans, trends). Embedded analytics stresses OLAP-style queries on operational data. Databases that blur this boundary (HTAP or real-time OLAP) reduce architecture complexity and data lag.
What’s the best database for sub-second query latency?
Columnar, real-time analytics databases with pre-aggregation, vectorized execution, and caching perform best. ClickHouse, Pinot, and SingleStore are common choices. Warehouses and OLTP databases rarely sustain sub-second latency under real user concurrency.
How much data ingestion throughput do I need?
Plan for peak usage, not averages. Consider events per user, concurrent active users, and future feature expansion. It’s safer to choose a system that can over-ingest cheaply than one that becomes a bottleneck during growth or launches.
Should I choose columnar or row-oriented storage?
For embedded analytics, columnar storage is usually the right default. It enables fast aggregations and scans across large datasets. Row-oriented storage works when transactional updates dominate and analytics are minimal.


