

.png)
Ever opened a spreadsheet with a thousand rows and dozens of columns, stared at the numbers, and felt them mock you back?
One report claims 5,000 active users. Another says 7,000. A third insists it's 6,200. You check again. Still different. No definitive answer. Pure chaos.
This exact scenario costs your team hours every week. Meetings turn into arguments about whose numbers are "right". Decisions get delayed while someone plays detective. Executives lose confidence in your data. And you're stuck explaining discrepancies instead of delivering insights.
After reading this, you'll understand:
- Why your teams have conflicting metrics
- The three layers of data modeling
- How to diagnose when your organization truly needs modeling
For a deeper dive into how different architectures implement these layers, see our data modeling architecture guide
During my time at an auditing firm, I experienced firsthand how messy and inconsistent data can derail important decisions. I relied on Excel to clean and reconcile small, semi-structured datasets. When the same data scaled and became repetitive, I turned to Alteryx to automate systematic cleaning workflows. But as data grew increasingly unstructured and spread across systems, formats, and definitions, I learned that dbt and a proper data model could bring lasting order and consistency.
Here's the truth I have seen time and again: the problem isn't your data, it's how you're thinking about it.
Most teams skip straight to tools without understanding the real issue: they haven't defined what they're measuring in the first place.
Data modeling fixes this immediately.
The Real Problem Isn't Your Data
Here's what actually happened to create your chaos:
Your marketing team defines "active user" as anyone who opened an email in the last 30 days. Your product team defines it as anyone who logged in during the last 14 days. Your finance team defines it as anyone with an active paid subscription.
Same term. Three different meanings. Three different numbers.
This isn't a data problem. It's a modeling problem.
Without a shared language for your data, every team builds their own interpretation. And every interpretation creates conflicting reports, wasted time, and decision paralysis.
What is Data Modeling? (The Simple Answer)
Data modeling is creating a shared language for your data. Think of it like this:
If your marketing team calls someone a "customer" and your finance team calls them a "subscriber" and your product team calls them a "user", you've got chaos.
Data modeling stops that defining:
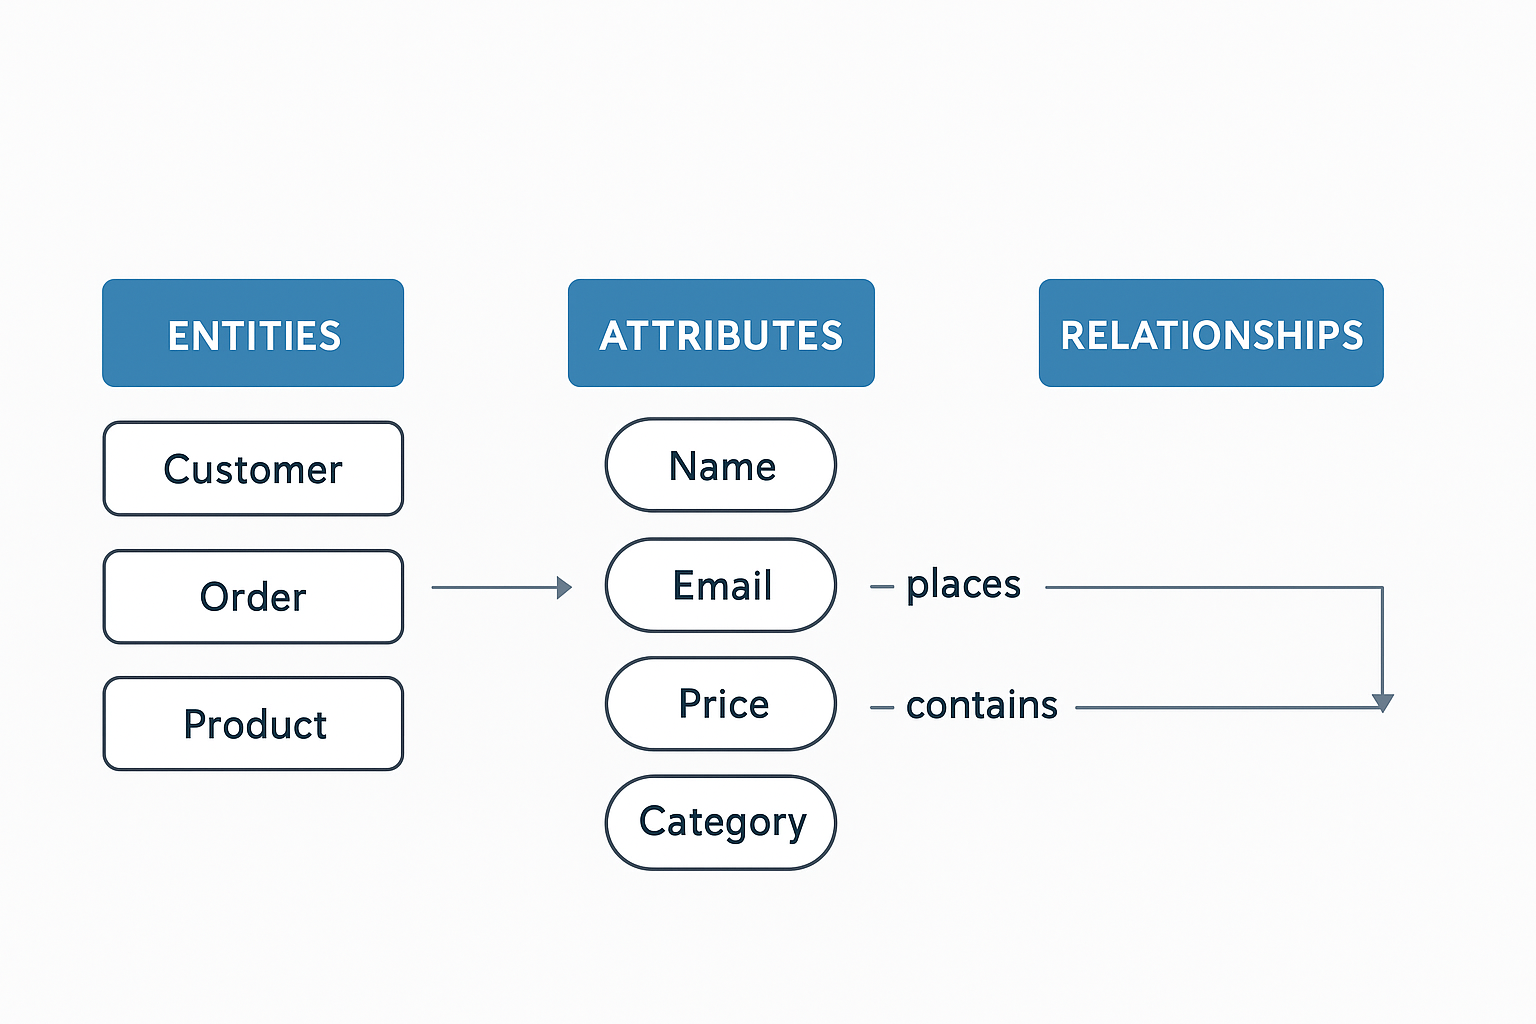
- What you're tracking (entities)
- How you describe it (attributes)
- How things connect (relationships)
- What the definitions mean (business rules)
When everyone speaks the same language, the chaos stops.
The Three Layers of Data Modeling: From Questions to Implementation
In my experience, understanding these three layers prevents most modeling mistakes. Each layer answers different questions and serves different stakeholders. Data modeling unfolds from abstract concepts to concrete implementation.
Layer 1: Conceptual Model: What Are We Actually Measuring?
This is your 30,000-foot view. Major entities and relationships. No technical details.
The problem without this layer:
Sales team tracks "customers" as anyone who ever bought anything. Support team tracks "customers" as anyone with an active account. Marketing team tracks "customers" as anyone on the email list.
Three teams. Three definitions. Three different counts when the CEO asks, "How many customers do we have?"
What the conceptual model does:
It answers the fundamental question: what are the core "things" our business tracks and how do they relate?
Example: Customers place Orders. Orders include Products. Products belong to Categories.
Simple. Effective. That's all you need at this stage.
The conceptual model helps business teams and data professionals align on what needs to be tracked and how major entities connect without getting lost in technical specifics. It's about capturing the essence of your business processes in a way everyone can understand.
I have seen this layer save projects. The conceptual model lets you see the big picture without drowning in jargon. Business leaders can contribute without worrying about tables or queries. When stakeholders can actually understand and validate your model, you avoid building the wrong thing.
Result at this layer:
Entity: Customer
Definition: A person or organization that has made at least one purchase
Key Attribute: customer_id (unique identifier)
Related Entities: Orders, Subscriptions, Support Tickets
Now "customer" means the same thing everywhere. When someone says "customer count," everyone knows exactly what's being measured.
Layer 2: Logical Model: How Do Things Connect?
The logical model adds structure: tables, columns, keys, rules. Still database-independent.
I have watched teams waste entire afternoons on this exact problem. Let's say you want to know which products are frequently purchased together—a simple question that reveals whether your data is properly modeled.
The problem without this layer:
Product data lives in one spreadsheet. Order data lives in another. There's no clear link between them. Analysis requires manual matching. It takes 3 hours, and the results are questionable because you're not sure if you caught everything.
What the logical model does:
It defines the specific structure of your data and the rules that govern relationships between entities.
Example: Each Order links to a Customer via customer_id. Products can appear in multiple Orders through the OrderItems junction table. Each Product has a category_id that references the Categories table.
Here's something I recommend to every team: sketch this on paper first. Drawing makes problems obvious in ways typing cannot. You'll spot missing relationships, circular dependencies, and data redundancy much faster with a whiteboard than with a database tool.
This layer bridges business understanding and technical detail. It focuses on how data is organized logically—identifying attributes, data relationships, and integrity constraints—but not yet worrying about performance or physical storage.
The relationships become explicit:
Customers → place → Orders
Orders → contain → Products (via OrderItems)
Products → belong to → Categories
This is where you define your foreign keys, establish cardinality (one-to-many, many-to-many), and document business rules that govern your data. It captures data rules before you write any code.
Result at this layer:
The relationships are clear. The query takes 10 seconds. The results are reliable. And anyone on the team can run the same analysis and get the same answer.
Layer 3: Physical Model: What Do These Numbers Actually Mean?
The physical model is implementation. Data types, indexes, partitions, performance optimizations.
I have seen this pattern play out: here's a real scenario I have seen affect team productivity.
The problem without this layer:
Company A had five different "active user" counts across five different dashboards:
12,450 (Marketing dashboard)
11,203 (Product analytics)
9,876 (Executive summary)
14,002 (Finance report)
10,555 (Support metrics)
Every meeting started with "Which number should we use?" Every decision got delayed while someone investigated the discrepancy.
What the physical model does:
It takes the logical structure and translates it into an actual database design with specific implementation details. Here, considerations like indexing, partitioning, and data distribution strategies come into play to ensure efficiency and scalability.
I have watched well-designed logical models fail in production because teams skipped proper physical modeling. A query that works fine with 10,000 rows can grind to a halt with 10 million rows if you haven't indexed properly. Proper physical modeling helps maintain query performance as data volume grows and guarantees system stability in production environments.
The fix: Define the metric once in the physical model.
Metric: active_users_30d
Definition: Users who logged in within the past 30 days AND have an active account
Business Owner: Product Team
Last Updated: 2025-01-15
Used By: All company dashboards
Even well-designed logical models can underperform if physical considerations like storage optimization and indexing are ignored. This layer ensures your system runs efficiently under real-world workloads. This is where your Excel sheets become database tables, your Alteryx workflows connect to optimized data structures, and your dbt models run against properly indexed sources.
Result at this layer:
One number. One definition. No arguments.
Why Most Teams Skip This (And Regret It)
Reason 1: We'll figure it out as we go
What happens:
- Month 1: 5 tables, seems manageable
- Month 6: 50 tables, getting messy
- Month 12: 200 tables, nobody knows what's where
- Month 18: $200K spent on cleanup
Better approach:
- Week 1: Map core entities (Customers, Products, Orders)
- Week 2: Define key relationships
- Week 3: Document business rules
- Total time: 3 weeks
- Prevents: 18 months of pain
Reason 2: Our data is too messy to model
This is backwards. Your data is messy because you don't have a model.
Real time scenario:
A company had:
- user_status column with values: {active, inactive, churned, suspended, trial, expired, cancelled}
- account_state column with values: {current, past, paused, deleted}
- subscription_status column with values: {paying, trial, grace_period, lapsed}
Three columns. Similar meanings. Complete chaos.
The fix:
Create a single source of truth in the model. See how it's done in Databrain's Semantic Layer. Define each status clearly with what it means and what access it grants.
Now there's one status, one definition, clear rules about what each status means. Your messy data becomes structured.
The Five Signals You Need Data Modeling Now
Signal 1: Dashboard Disagreements
I have sat through meetings that start with this question: Why does the sales dashboard show different revenue than the finance report?
If this question comes up more than once a quarter, you have a modeling problem.
Signal 2: The Data Detective Role
Someone on your team spends most of their time tracking down where data comes from, explaining what fields mean, reconciling different reports, and answering "which number is right?"
This shouldn't be a job. It's a symptom of missing data models.
Signal 3: Query Fear
Your team is afraid to write queries because they're not sure which tables to use, they don't know what the columns mean, previous queries gave wrong results, or it's easier to ask someone than figure it out themselves.
When querying your own data feels like archaeology, you need modeling.
Signal 4: Meeting Overhead
You spend hours in meetings debating what "active" means, how to calculate churn, which customer count is correct, or whether to trust the dashboard.
These shouldn't be debates. They should be documented definitions that anyone can reference.
Signal 5: Onboarding Pain
New hires take 3-6 months to become productive with data because no documentation exists, column names are cryptic (usr_sts_cd_2), tribal knowledge is the only knowledge, and everyone has a different mental model.
This is a massive hidden cost that proper modeling eliminates.
Your Next Steps: The 2-Week Quick Start
Don't try to model everything. Start with what hurts most.
Week 1: Identify Your Core Entities
Day 1-2: Entity Discovery
List the 10 most important "things" your business tracks. For E-commerce, you might track things like customers, orders, products, and payments. For SaaS, your key entities could be users, accounts, subscriptions, and features. For marketplaces, focus on buyers, sellers, listings, and transactions.
Day 3-4: Relationship Mapping
Draw how your entities connect. Customers place Orders. Orders contain Products. Customers have Subscriptions. Subscriptions include Features.
Day 5: Validate with Stakeholders
Questions to ask each team:
- What entities do you work with daily?
- What's confusing or unclear about our current data?
- What definitions cause the most arguments?
Week 2: Define Your First Critical Metric
Pick ONE metric that causes the most confusion. Common candidates: active users, churn rate, conversion rate, revenue (MRR/ARR), customer lifetime value.
Document it thoroughly:
- Metric Name: Monthly Active Users (MAU)
- Definition: Unique users who performed at least one core action in the past 30 days
- Core Actions Include: Logged into the platform, created or edited content, shared or collaborated, used any premium feature
- Exclusions: Deleted accounts, suspended accounts, admin/test accounts
- Business Owner: Head of Product
- Technical Owner: Data Engineering Team
- Last Updated: 2025-01-15
- Review Frequency: Quarterly
Implementation:
- Create as a database view
- Point all dashboards to this view
- Deprecate old calculations
- Document in your data dictionary
Result: One number. One definition. No confusion.
What's Next
This was an introduction to why modeling matters. For technical implementation details, advanced patterns, and tool comparisons, see our Part 2: Data Modeling Architecture blog. In which we'll go deeper into choosing the right schema (Star vs Snowflake vs Galaxy), normalization strategies (when and how), performance optimization techniques, implementing document and graph models, and practical decision frameworks for real scenarios.
But start here. Define your core entities. Document your critical metrics. Create the shared language your data has been missing.
The chaos stops when everyone speaks the same language.
In a section on consequences of poor semantic models, search-driven tools like ThoughtSpot Embedded Analytics depend heavily on a clean model to deliver accurate search results and natural language queries.
Related Reads
Frequently Asked Questions
We're too small to need data modeling - is that true?
If you have more than 5 tables, more than 3 people querying data, any custom reports, or any dashboard, you need modeling. Size doesn’t determine need—complexity does. And complexity arrives faster than most teams expect.
Our data changes too frequently to model - what should we do?
That’s exactly why you need modeling. Frequent changes without structure equals chaos. Models are meant to evolve. Version them, document changes, and treat them as living architecture rather than fixed designs.
Can we hire someone to figure out the data?
You can hire someone to create the model. But the business definitions must come from your team. Nobody outside your company can tell you what ‘active user’ means in your context.


