The Ultimate Guide to Data Modeling: Concepts, Techniques, and Best Practices

.png)
Key Takeaways
- Data modeling defines entities, attributes, and rules before you build tables, so every team works from one shared definition.
- Poor data quality is the top daily complaint for 56% of data professionals (dbt Labs, 2025); solid modeling is the first defense against it.
- Start with a star schema; move to snowflake or galaxy schemas only when hierarchies or shared dimensions require it.
- Customer-facing dashboards need a tenancy model decided before schema design, not bolted on afterward.
Rushing into tables without a plan is how most data projects wobble. You can ship something fast, but it won't hold up once the business asks a harder question next quarter.
Data modeling is the plan. It turns scattered, inconsistent inputs into a structure people can actually trust, and it's the difference between a dashboard that answers a question and one that starts an argument. Poor data quality is still the top daily complaint among data teams: 56% of data professionals cite it as their most frequent challenge (dbt Labs State of Analytics Engineering, 2025). Good modeling won't fix a messy source system, but it stops that mess from spreading into every report downstream.
This guide covers the essentials: what data modeling means, the three layers every model passes through, six modeling techniques, the process, and the practices that keep a model useful as your data grows. Whether you're building your first pipeline or maintaining a mature warehouse, the same fundamentals hold up where it matters: in production.
What Is Data Modeling?
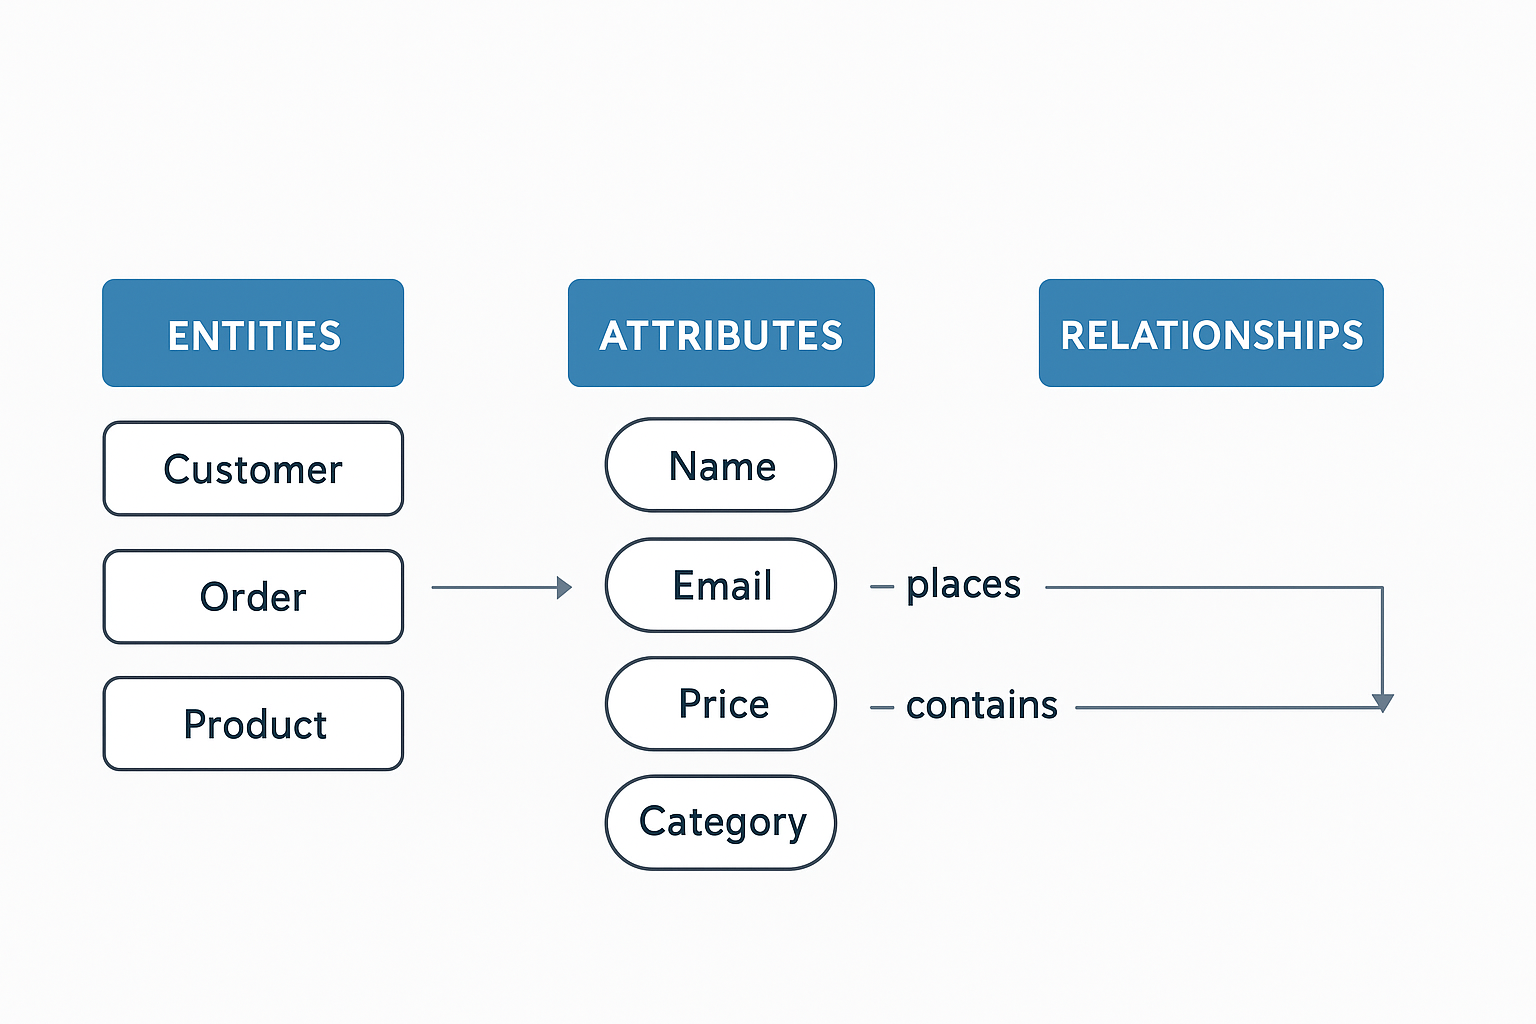
Data modeling is the process of defining how your data is organized: what you track (entities), how you describe each thing (attributes), and how records connect to each other (relationships). It also pins down what every definition actually means (business rules). It is the blueprint for your data. The model turns real-world concepts like customers, orders, and products into a structure that is easy to query and hard to break. The practical payoff is a shared language: when marketing, product, and finance each define "active user" differently, you get three dashboards with three different numbers and a weekly argument about which one is right. A data model fixes that by defining each entity and metric once, so every report, query, and machine learning feature draws from the same definitions.
Data modeling happens in three layers: a conceptual model that captures what the business cares about, a logical model that adds structure and rules, and a physical model that implements it on your database. The rest of this guide walks through each layer, the main modeling techniques, and the best practices that keep models useful as data grows.
One quick note on spelling: "data modeling" and "data modelling" describe the same discipline. The US version drops the second "l"; everywhere else keeps it, and you'll see both spellings used interchangeably across vendor documentation.
Why Does a Good Data Model Matter?
A good model matters because bad structure gets expensive fast. Two-thirds of data leaders reported a data incident costing over $100,000 in the past six months, and 70% took more than four hours just to detect it (Monte Carlo State of Reliable AI Survey, 2024). A clear model catches structural problems before they turn into six-figure ones.
Here's what a solid model actually buys you:
.png)
- Builds trust. When everyone uses the same definitions and entities, marketing, product, and finance see the same numbers instead of arguing over which dashboard is right.
- Speeds delivery. Clearly defined relationships, keys, and constraints reduce rework and make true self-service analytics possible.
- Controls cost. Good partitioning and clustering cut full scans and wasted compute.
- Adapts to change. Versioned schemas evolve without breaking what's downstream.
- Boosts quality and governance. Clear constraints and defined ownership help catch problems early and manage access properly.
- Prepares you for machine learning. Well-documented, reusable features keep training and inference consistent, so the model your data scientists train on Monday reads from the same definitions your dashboards used all weekend.
How Has Data Modeling Evolved?
The way we shape data has shifted over the last fifty years, but the underlying discipline hasn't changed much. In the 1970s and 1980s, relational models and ER diagrams took over transactional systems: record accurately, retrieve quickly. The 2000s brought dimensional modeling, with star and snowflake schemas making reports fast and decision-friendly.
The 2010s introduced big data and data lakes, with teams loading first and shaping later through flexible ELT. Today, real-time processing sits beside batch and cloud warehouses scale with little fuss. Semantic layers align business definitions, and AI increasingly suggests keys, relationships, and optimizations. For more on that last shift, see how AI is integrated with data modeling today.
The Three Types of Data Models: Conceptual, Logical, Physical
Data modeling works in three layers, moving from business meaning to working code. A conceptual model captures what the business cares about, a logical model adds structure and rules, and a physical model implements everything on your actual database. Skip a layer, and the system you ship won't match how the business really works.
Picture a B2B SaaS product: organizations sign up, users belong to an organization, and each user generates events inside the product. That single example threads through all three layers below.
Conceptual Model: What the Business Actually Cares About
Capture the business view without technical noise: high-level entities and relationships. Organizations have users, users generate events, events roll up into usage that gets billed. It's the handshake between domain experts and engineers. Skip it, and you risk a system that's correct on paper but misaligned with how the business actually works.
Logical Model: Adding Structure and Rules
Define tables (or collections), attributes, keys, and constraints, still independent of any specific database. Organization has Org_ID, Name, and Plan; User has User_ID, Org_ID, and Email; Event has Event_ID, User_ID, Type, and Timestamp. The relationships are explicit and enforceable: every user belongs to exactly one organization, every event traces back to exactly one user. A clear logical model prevents confusion and keeps teams on the same definitions.
Physical Model: Making It Real
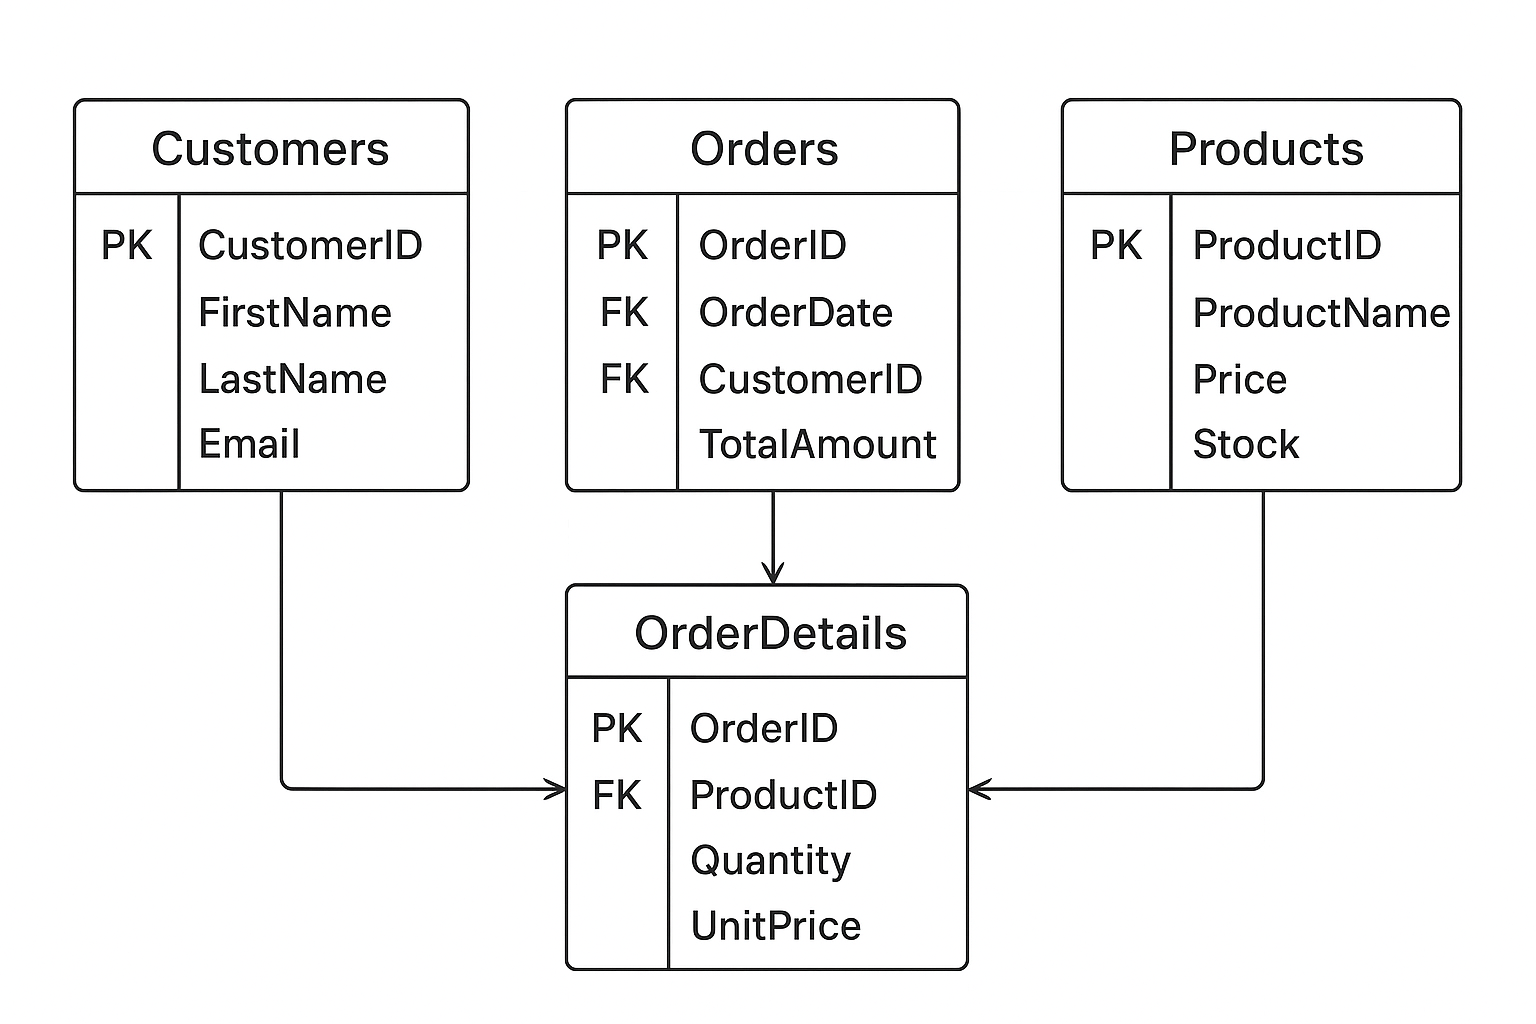
Turn the design into an actual schema. Choose types, create indexes, plan partitions, and tune for performance. The same pattern applies whether you're modeling organizations and users or a simpler customer and order pair. In SQL, it looks like this:
CREATE TABLE Customer (
    Customer_ID INT PRIMARY KEY,
    Name VARCHAR(100),
    Email VARCHAR(255) UNIQUE
);

CREATE TABLE Orders (
    Order_ID INT PRIMARY KEY,
    Order_Date DATE,
    Customer_ID INT,
    FOREIGN KEY (Customer_ID) REFERENCES Customer(Customer_ID)
);
Email is UNIQUE, Customer_ID gets an index for fast joins, and Orders can partition by date once the table grows large.

Each layer builds on the last one. Skip the conceptual step and your logical model won't reflect the business. Rush the physical model and maintenance costs pile up fast. Get all three right and you end up with a schema that's technically sound and genuinely useful.
Which Data Modeling Techniques Should You Use?
The right technique depends on how the data actually gets used, not on personal preference. Dimensional modeling powers fast dashboards, relational modeling protects transactional integrity, and four other patterns each solve a narrower problem. Most production systems combine two or three of these rather than picking just one.
- Dimensional modeling (star/snowflake). Fact tables link to dimension tables like product, customer, and date. Best for: fast, repeatable BI dashboards where query speed matters more than flexibility.
- Relational/normalized modeling. Keys and constraints enforce integrity. Best for: transactional systems where clean updates matter more than read speed.
- Document modeling. Nested, flexible records. Best for: catalogs, content, and data whose shape changes often.
- Graph modeling. Nodes and edges built for relationship-heavy queries where the connections between records matter as much as the records themselves. Best for: recommendations, fraud detection, and network analysis.
- Data vault modeling. Hubs, links, and satellites separate stable business keys from attributes that change often. Best for: enterprise warehouses that need full history and frequent source changes without a redesign.
- Hierarchical and time-series modeling. Parent-child trees for hierarchical data; timestamped sequences for time-series data. Best for: org charts and category trees (hierarchical); sensor feeds and IoT streams (time-series).
Star Schema vs Snowflake Schema: A Decision Framework
Within dimensional modeling, the star vs snowflake choice determines your query speed, storage footprint, and maintenance overhead. Most teams should start with a star schema and move to snowflake only when dimensions carry real hierarchical depth or redundancy becomes a genuine cost. Galaxy schemas solve a related but different problem: sharing dimensions across multiple fact tables.
In our experience, teams do best starting with a star schema and only moving to snowflake when a dimension has deep hierarchical relationships, products nested under subcategories nested under categories, for example, or when redundancy starts creating real storage cost and consistency problems. If several fact tables share the same dimensions, sales, inventory, and shipments all keyed to product and date, a galaxy schema lets them share one set of conformed dimensions instead of duplicating each one.
The Data Modeling Process: 6 Repeatable Steps
The data modeling process runs from naming the entities you care about to validating the finished schema against real data. Skipping straight to table design is the shortcut that costs teams a rebuild six months later. The sequence matters more than any single tool you use.
.png)
- Identify entities. Name the real-world things you're tracking: organizations, users, events, orders.
- Define attributes. List what you need to know about each.
- Map relationships. Decide how entities connect, and the cardinality of each connection.
- Choose your technique. Dimensional, relational, document, graph, or a hybrid, based on how the data will be queried.
- Implement physically. Pick data types, keys, indexes, and partitions on your actual database.
- Validate and iterate. Test the schema against production-like data before anyone builds on it, then keep watching real query patterns after launch. No model survives contact with production unchanged.
What Are Data Modeling Best Practices?
Good practices exist because bad ones are expensive: data quality issues derail 45% of AI and analytics scaling efforts, according to Anaconda's 2025 State of Data Science and AI report (Anaconda, 2025). The practices below, covering normalization, keys, partitioning, and versioning, are what keep a model from becoming that statistic.
Normalization vs. Denormalization
OLTP systems typically lean on normalization for integrity and efficient updates. OLAP systems often denormalize to cut down on joins and keep reads fast. Most modern stacks mix the two: normalized for operations, carefully denormalized for analytics. Let your access patterns and latency goals decide the split, and revisit the decision as usage changes.
Normalization itself comes in named levels, and it's worth knowing what each one actually requires:
Natural Keys vs. Surrogate Keys
Natural keys, like email addresses or product SKUs, come from the real world and can change or collide across systems. Surrogate keys (system-generated IDs) stay stable, make joins cheaper, and travel safely across services. Most teams default to surrogate keys for anything crossing system boundaries, and reserve natural keys for lookups where uniqueness is already guaranteed.
Partitioning and Indexing for Cloud Warehouses
Cloud engines can swallow huge datasets, but layout still matters. Partition large tables, by date or region, for example, to limit what each query scans. Cluster or index the columns you filter on repeatedly. Indexes speed up reads but slow down writes, so choose based on your read/write ratio and review the decision as workloads change.
Schema Versioning and the Semantic Layer
Treat schemas like code: version them, document changes, support rollbacks, and keep a history. Tools like dbt make this routine and help you avoid quiet schema drift. Pair versioning with a semantic layer that keeps definitions consistent across tools, so "active user" means the same thing in your BI tool as it does in an embedded customer dashboard.
How Does Customer-Facing Analytics Change the Model?
Modeling for customer-facing analytics adds a constraint most internal BI never faces: the same schema has to serve many different customers safely and fast, without any of them seeing another's data. That single requirement, multi-tenancy, changes how you design tables from day one.
The tenancy model becomes a first design decision, not an afterthought. A shared schema with a tenant_id column on every fact table scales operationally, one model to maintain as customers grow into the hundreds, but it demands strict row-level security enforced at the query layer. Schema-per-tenant isolates data more cleanly, but the maintenance burden multiplies with every new customer you onboard.
Row-level security has to be baked into the model itself. Every query needs a tenant filter applied consistently, because one misconfigured join is enough to expose another customer's rows. The teams we've seen get this right treat it as a modeling decision rather than something application code catches later. They find the problem before it ships.
Star schemas tend to fit self-service embedded dashboards particularly well here. Fewer joins mean customers querying their own data through natural-language or drag-and-drop tools get consistent, fast performance without needing to understand a snowflaked hierarchy underneath. That same principle applies whether you build the dashboard layer yourself or use customer-facing analytics software on top of your warehouse. This is the exact problem embedded analytics platforms like DataBrain solve for: the modeling decisions happen once, and every tenant's dashboard queries the same governed schema safely. See our breakdown of embedded analytics architecture patterns for more on how tenancy and schema design interact in practice.
Where Do Data Models Show Up in Practice?
Every industry applies data modeling differently, but the same three layers show up everywhere. SaaS teams blend relational billing tables with event streams for product usage. Retailers lean on dimensional models for sales and inventory. The technique changes; the underlying discipline doesn't.
SaaS Products: From Signup to Churn. Relational tables handle billing and subscriptions, event streams capture product usage, and document stores hold support tickets and feedback. Together they build one connected view of the customer journey, from activation through expansion to churn.
E-commerce: Understanding Customer Behavior. A star schema tying a sales fact table to product, customer, and time dimensions powers real-time views like top sellers and hourly revenue. A lightweight graph layer handles recommendations, improving personalization and average order value.
Financial Services: Compliance and Risk. Banks lean on normalized models for audit trails and regulator-ready reporting; every transaction has to be precise and traceable. For risk analytics, dimensional marts aggregate exposure by region, portfolio, and asset class so the numbers stay fast and consistent. Fintech SaaS teams face both constraints at once, which is why embedded fintech dashboard architecture layers real-time views on top of audited historical models.
IoT and Real-Time Systems: Sensor Data. When millions of devices send events continuously, batch processing alone can't keep up. Event-oriented models handle ingestion at that scale, while time-series databases support real-time analysis and alerting while the data is still fresh.
Data Modeling Tools You Should Know
Data modeling tools split into three groups: classic diagramming tools for relational systems, modern transformation tools built around your warehouse, and cloud-native platforms that add governance on top. The right pick depends on your team, your platform, and the kind of modeling you're doing.
- Classic tools. ERWin, Toad, and ER/Studio remain the standard for traditional relational and enterprise systems.
- Modern tools. dbt, LookML, and SQLMesh focus on transformations, semantic layers, and analytics-ready models defined directly in code.
- Cloud and AI tools. Platforms like Databricks Unity Catalog and Snowflake's Semantic Layer add governance, lineage, and access control on top of the warehouse itself.
The right choice comes down to your team, your platform, and the type of modeling you're doing, transactional, analytical, or streaming, rather than whichever tool has the longest feature list.
AI now assists parts of this work too. 80% of data practitioners already use AI somewhere in their daily workflow, up from 30% a year earlier, and 70% of those use it specifically for code development (dbt Labs State of Analytics Engineering, 2025). Right now it shows up more in schema suggestions and anomaly detection than in full model design. For a deeper look at where that's headed, see how modern data architectures use AI.
Glossary
- Fact table: The table that stores the "things that happened" with numbers attached, like each sale, click, or payment and its measures (revenue, quantity, duration).
- Dimension: The who, what, when, and where that describes your facts, customers, products, dates, regions, used to slice and filter reports.
- Surrogate key: A stable, system-generated ID (like customer_key) that doesn't change, making joins reliable even if natural identifiers like email do change.
- Semantic layer: A business-friendly map of your data that standardizes metrics and definitions, so "active user" or "net revenue" means the same thing everywhere.
- Star schema: A dimensional modeling approach where a central fact table connects directly to multiple dimension tables, enabling efficient, easily interpretable querying.
- Snowflake schema: A dimensional model where dimension tables are further normalized into sub-tables, improving structure and consistency for large datasets.
- Normalization: The practice of organizing data to reduce redundancy, maintain consistency, and protect overall data integrity.
- Denormalization: The intentional introduction of redundancy, or merging of tables, to simplify queries and improve read performance.
Related Reads
Frequently Asked Questions
What is the most important consideration in data modeling?
Understanding the business process you're modeling matters more than any technical choice. Agree on what an "order" or an "active user" actually means before you touch a single table. Get the definitions right first; the schema that implements them is comparatively easy to fix later.
Why is data modeling important?
It gives every team the same source of truth. Clear entities and relationships mean marketing, product, and finance stop arguing over whose dashboard is correct, and clean keys and constraints make self-service analytics possible without breaking things downstream.
What is the difference between a data model and a schema?
A schema is the physical layout: the actual tables, columns, and types in one database. A data model is the full journey, agreeing on business concepts, defining relationships, then implementing and tuning them. A single SQL view or dbt transformation isn't a data model on its own; it's one implementation of the agreed structure underneath it.
When should you denormalize a data model?
Denormalize when reads dominate and complex joins are slowing dashboards down. If a common query needs several heavy joins just to return an answer, denormalizing can meaningfully speed things up. Keep clear lineage back to the source data so you don't lose track of where the numbers came from.
Star schema or snowflake schema: which should you use?
Start with a star schema; it's simpler to query and fast enough for most BI use cases. Move to snowflake when dimensions carry real hierarchical depth or redundancy becomes a genuine storage problem.


