

.png)
For self-hosted DataBrain (Enterprise): Configure the API to export traces and metrics via OpenTelemetry (OTLP) to your own backend: Datadog, New Relic, Grafana, or any OTLP-compatible platform. No vendor lock-in, no extra agents. Cloud customers: DataBrain already uses OpenTelemetry by default for logging and observability.
Availability: This feature is available for self-hosted DataBrain customers on the Enterprise plan.
Self-hosted deployments need to fit into your existing observability practices. If you're evaluating self-hosted embedded analytics, see Why Self-Hosted Embedded Analytics Matter in 2026 and Self-Hosted Embedded Analytics with Enterprise Security. Proprietary agents and vendor-specific SDKs add complexity and often conflict with security and platform standards. Many enterprises already standardize on OpenTelemetry and OTLP: so your analytics API should plug into that same pipeline.
Today we're launching configurable OpenTelemetry (OTLP) support for the self-hosted DataBrain API. Enable it with three environment variables and send traces and metrics to your chosen OTLP endpoint. No custom agents, no lock-in: just standard telemetry that works with Datadog, New Relic, Grafana, Honeycomb, and the rest of your stack. If you're on DataBrain Cloud, you already benefit from OpenTelemetry-based observability by default; this launch gives self-hosted Enterprise customers the same capability and full control over where telemetry goes.
Why OpenTelemetry for Self-Hosted Embedded Analytics
Self-hosted embedded analytics should integrate smoothly with your existing observability stack. OpenTelemetry (OTLP) gives you vendor-neutral instrumentation that fits any backend: no proprietary agents or vendor lock-in. Here's what that means in practice.
One Instrumentation, Any Backend
OTLP is supported by all major observability vendors. You can:
- Keep your current backend: Point DataBrain at your existing OTLP endpoint (collector or vendor).
- Avoid duplicate agents: No DataBrain-specific agent; use the same pipeline as your app.
- Switch backends later: Change collector or vendor without re-instrumenting DataBrain.
Operations and SRE
Your SRE and platform teams get a unified view of the DataBrain API alongside the rest of your services:
- Unified view: API latency, errors, and throughput appear next to your app and database metrics.
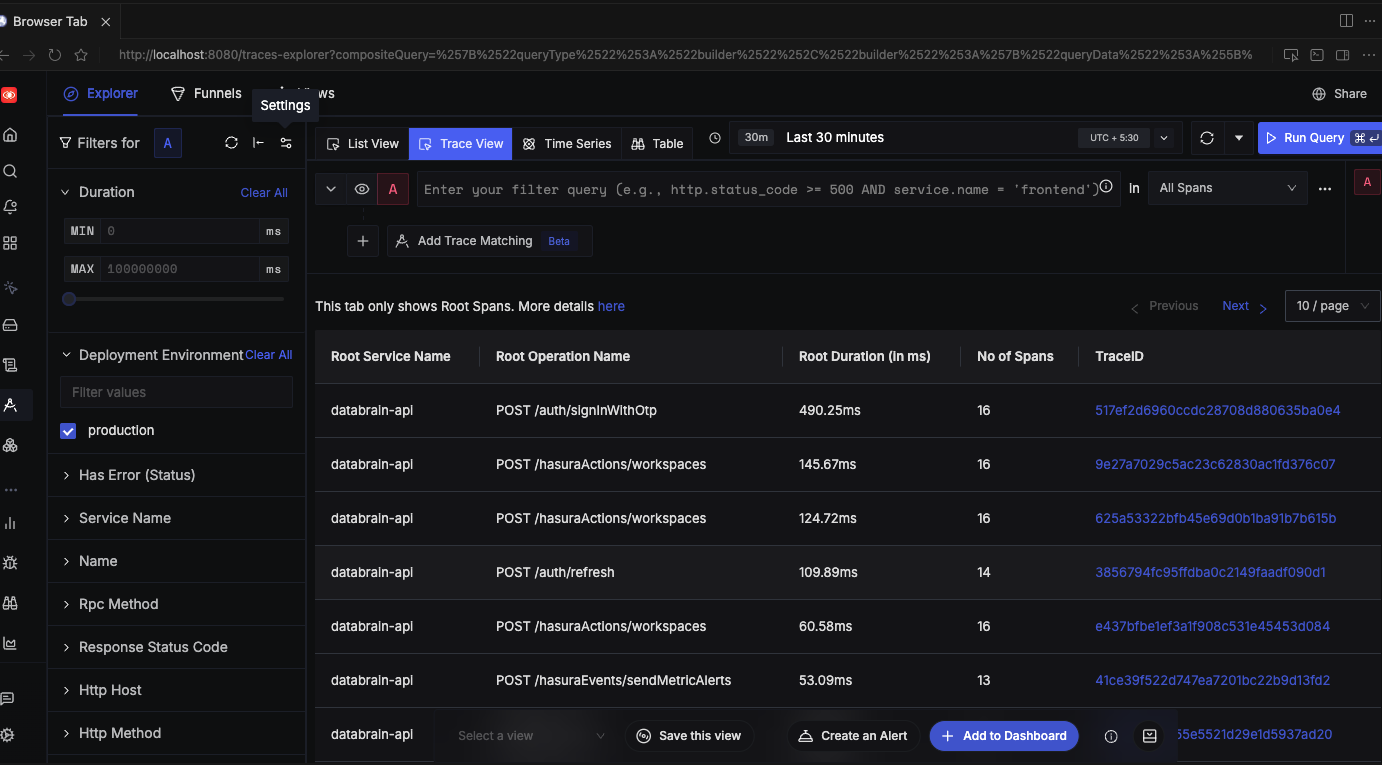
- Request tracing: See full request flows (HTTP → Express → PostgreSQL/Redis) in your trace UI.
- Correlated logs: When using Winston, trace context can be attached for log-to-trace correlation.
If you also route analytics API traffic through your own backend (e.g. for zero-token frontends), Proxy Authentication gives you centralized monitoring: all analytics requests flow through your infrastructure and show up in your observability stack alongside DataBrain's own OTLP export.
Security and Compliance
Enterprises with strict security and compliance requirements benefit from a standard, opt-in approach:
- No new agents: Fewer moving parts and fewer things to approve in locked-down environments.
- Standard protocol: OTLP over HTTP fits typical firewall and proxy policies.
- Opt-in: Telemetry is off unless you set
OTEL_ENABLED=trueand an endpoint; zero overhead when disabled.
What DataBrain Exports
When enabled, the DataBrain API exports traces and metrics using standard OTLP HTTP. Here's what you get in your observability backend.
Traces (OTLP HTTP)
- HTTP: Incoming and outgoing HTTP requests.
- Express: Route-level spans (e.g.
/api/v2/...). - PostgreSQL: Database query spans (when using
pg). - Redis: Commands (when using
ioredis). - Winston: Log correlation with active trace/span when enabled.
Spans use standard OpenTelemetry semantic conventions where applicable, so they align with the rest of your services.
Metrics (OTLP HTTP)
Runtime and request metrics from the Node.js auto-instrumentation are exported periodically to your OTLP metrics endpoint:
- Runtime and request metrics from the Node.js auto-instrumentation.
- Exported periodically (e.g. every 60 seconds) to your OTLP metrics endpoint.
Optional: Manual Trace Context
For custom instrumentation or logging, DataBrain exposes a getTraceContext() helper that returns the current traceId and spanId when OpenTelemetry is enabled, so you can attach them to logs or custom spans.
How It Works
Configuration is entirely via environment variables: no code changes required. The flow is simple:
- Enable: Set
OTEL_ENABLED=trueandOTEL_EXPORTER_OTLP_ENDPOINT(and optionallyOTEL_SERVICE_NAME) in the DataBrain API environment. - Endpoint: DataBrain sends traces to
{endpoint}/v1/tracesand metrics to{endpoint}/v1/metrics(standard OTLP HTTP paths). - Backend: Your collector or vendor ingests OTLP and displays traces/metrics with the rest of your telemetry.
When OpenTelemetry is disabled, the SDK is not loaded, so there is no runtime cost.
Getting Started in 3 Steps (Self-Hosted API)
Total setup time: under 5 minutes. You'll need your OTLP endpoint URL (from OpenTelemetry Collector, Datadog, New Relic, Grafana Cloud, etc.) and network access from the DataBrain API to that endpoint.
1. Set Environment Variables
OTEL_ENABLED=true
OTEL_EXPORTER_OTLP_ENDPOINT=https://your-collector.example.com  # or http://localhost:4318
OTEL_SERVICE_NAME=databrain-api  # optional; default is databrain-api
Use your existing OTLP endpoint. Ensure the API can reach it (network/firewall). For step-by-step setup and vendor-specific examples (Datadog, Grafana Cloud, New Relic, Honeycomb, SigNoz, and more), see the Observability setup guide in the DataBrain docs.
2. Restart the DataBrain API
On startup, if OTEL_ENABLED=true and the endpoint is set, you'll see:
[Telemetry] OpenTelemetry initialized - service: databrain-api, endpoint: ...
3. Confirm in Your Backend
In your observability UI, look for the service name you set (e.g. databrain-api). You should see traces for API requests and, if configured, metrics.
Total setup time: under 5 minutes.
Key Benefits for Teams
BenefitDescriptionVendor-neutralUse Datadog, New Relic, Grafana, Honeycomb, or any OTLP-capable backend.No extra agentsDataBrain exports OTLP directly; no vendor-specific agent on the host.Zero cost when offTelemetry is opt-in; when disabled, OpenTelemetry is not loaded.Standard semanticsSpans follow OpenTelemetry conventions for easier correlation.Fits enterpriseOne protocol, one pipeline, simpler security and compliance review.
Example: DataBrain in Your Observability Stack
Scenario: You run the DataBrain API in Kubernetes and use an OpenTelemetry Collector to send data to Grafana Cloud (or another backend).
- Deploy the Collector with an OTLP HTTP receiver and your exporter (e.g. Grafana OTLP).
- Set
OTEL_EXPORTER_OTLP_ENDPOINTto the Collector's OTLP HTTP URL (e.g.http://otel-collector.monitoring.svc:4318). - Restart the DataBrain API with
OTEL_ENABLED=trueandOTEL_SERVICE_NAME=databrain-api.
You then get DataBrain API traces and metrics in the same place as your other services, with consistent naming and correlation.
Next Steps (Self-Hosted Enterprise)
- Enable in your environment: Add the three variables to your self-hosted API, restart, and confirm traces/metrics in your backend.
- Docs: Observability setup guide for full configuration, troubleshooting, and vendor-specific guides (Datadog, Grafana Cloud, New Relic, Honeycomb, SigNoz, and more).
- Need help?: Contact us or talk to our team if you want to discuss collector topology or best practices for your stack.
Summary
- OpenTelemetry (OTLP) for self-hosted DataBrain (Enterprise): configure the API to export traces and metrics over HTTP to your own backend.
- Configure with
OTEL_ENABLED,OTEL_EXPORTER_OTLP_ENDPOINT, and optionalOTEL_SERVICE_NAME. - Use any OTLP backend: no vendor lock-in, no extra agents.
- Opt-in and zero overhead when disabled.
- Cloud customers: DataBrain already uses OpenTelemetry by default for observability; this launch extends that capability to self-hosted Enterprise with full control over where telemetry is sent.
Contact us · Observability setup guide · Documentation · Enterprise & self-hosted
Related Articles
- Why Self-Hosted Embedded Analytics Matter in 2026: When and why to choose self-hosted embedded analytics.
- Self-Hosted Embedded Analytics with Enterprise Security: Platform comparison and security architecture for enterprise deployments.
- Zero-Token Frontend: DataBrain's Proxy Authentication: Route analytics through your backend for centralized monitoring and vendor abstraction.
- Announcing DataBrain's CockroachDB Integration: Global multi-tenant embedded analytics (another Enterprise-oriented launch).
- View all Product Updates: Latest DataBrain launches and guides.
Frequently Asked Questions
Do I have to use OpenTelemetry?
No. For self-hosted Enterprise, OpenTelemetry export is opt-in. Set OTEL_ENABLED=true and OTEL_EXPORTER_OTLP_ENDPOINT only when you want to send telemetry to your own backend. Default is off.
What if I don't set an endpoint?
If OTEL_ENABLED=true but OTEL_EXPORTER_OTLP_ENDPOINT is missing or empty, DataBrain logs a warning and does not initialize the SDK. No telemetry is sent.
Who can use this?
Self-hosted DataBrain on the Enterprise plan. Configure the environment variables on your API instance and point them at your own collector or vendor endpoint. Cloud customers already have OpenTelemetry-based observability by default.
Which backends are supported?
Any backend that accepts OTLP over HTTP (e.g. OpenTelemetry Collector, Datadog, New Relic, Grafana Cloud, Honeycomb, Splunk, AWS X-Ray via collector). DataBrain does not ship a vendor-specific exporter.
Is there a performance impact when enabled?
When disabled, there is no impact (SDK not loaded). When enabled, overhead is the same as for typical OpenTelemetry Node.js auto-instrumentation. For most deployments this is negligible.


