
Build Context-Aware Dashboards in DataBrain: Sections, Saved Views, and Drill-Down
One DataBrain dashboard can serve many contexts if you design it with sections, saved views, and cross-dashboard drill-down. This guide shows how to use section filters, named view presets, and click-through context to give sales, support, and execs their own tailored, context-aware views—without duplicating dashboards or metrics.

.png)
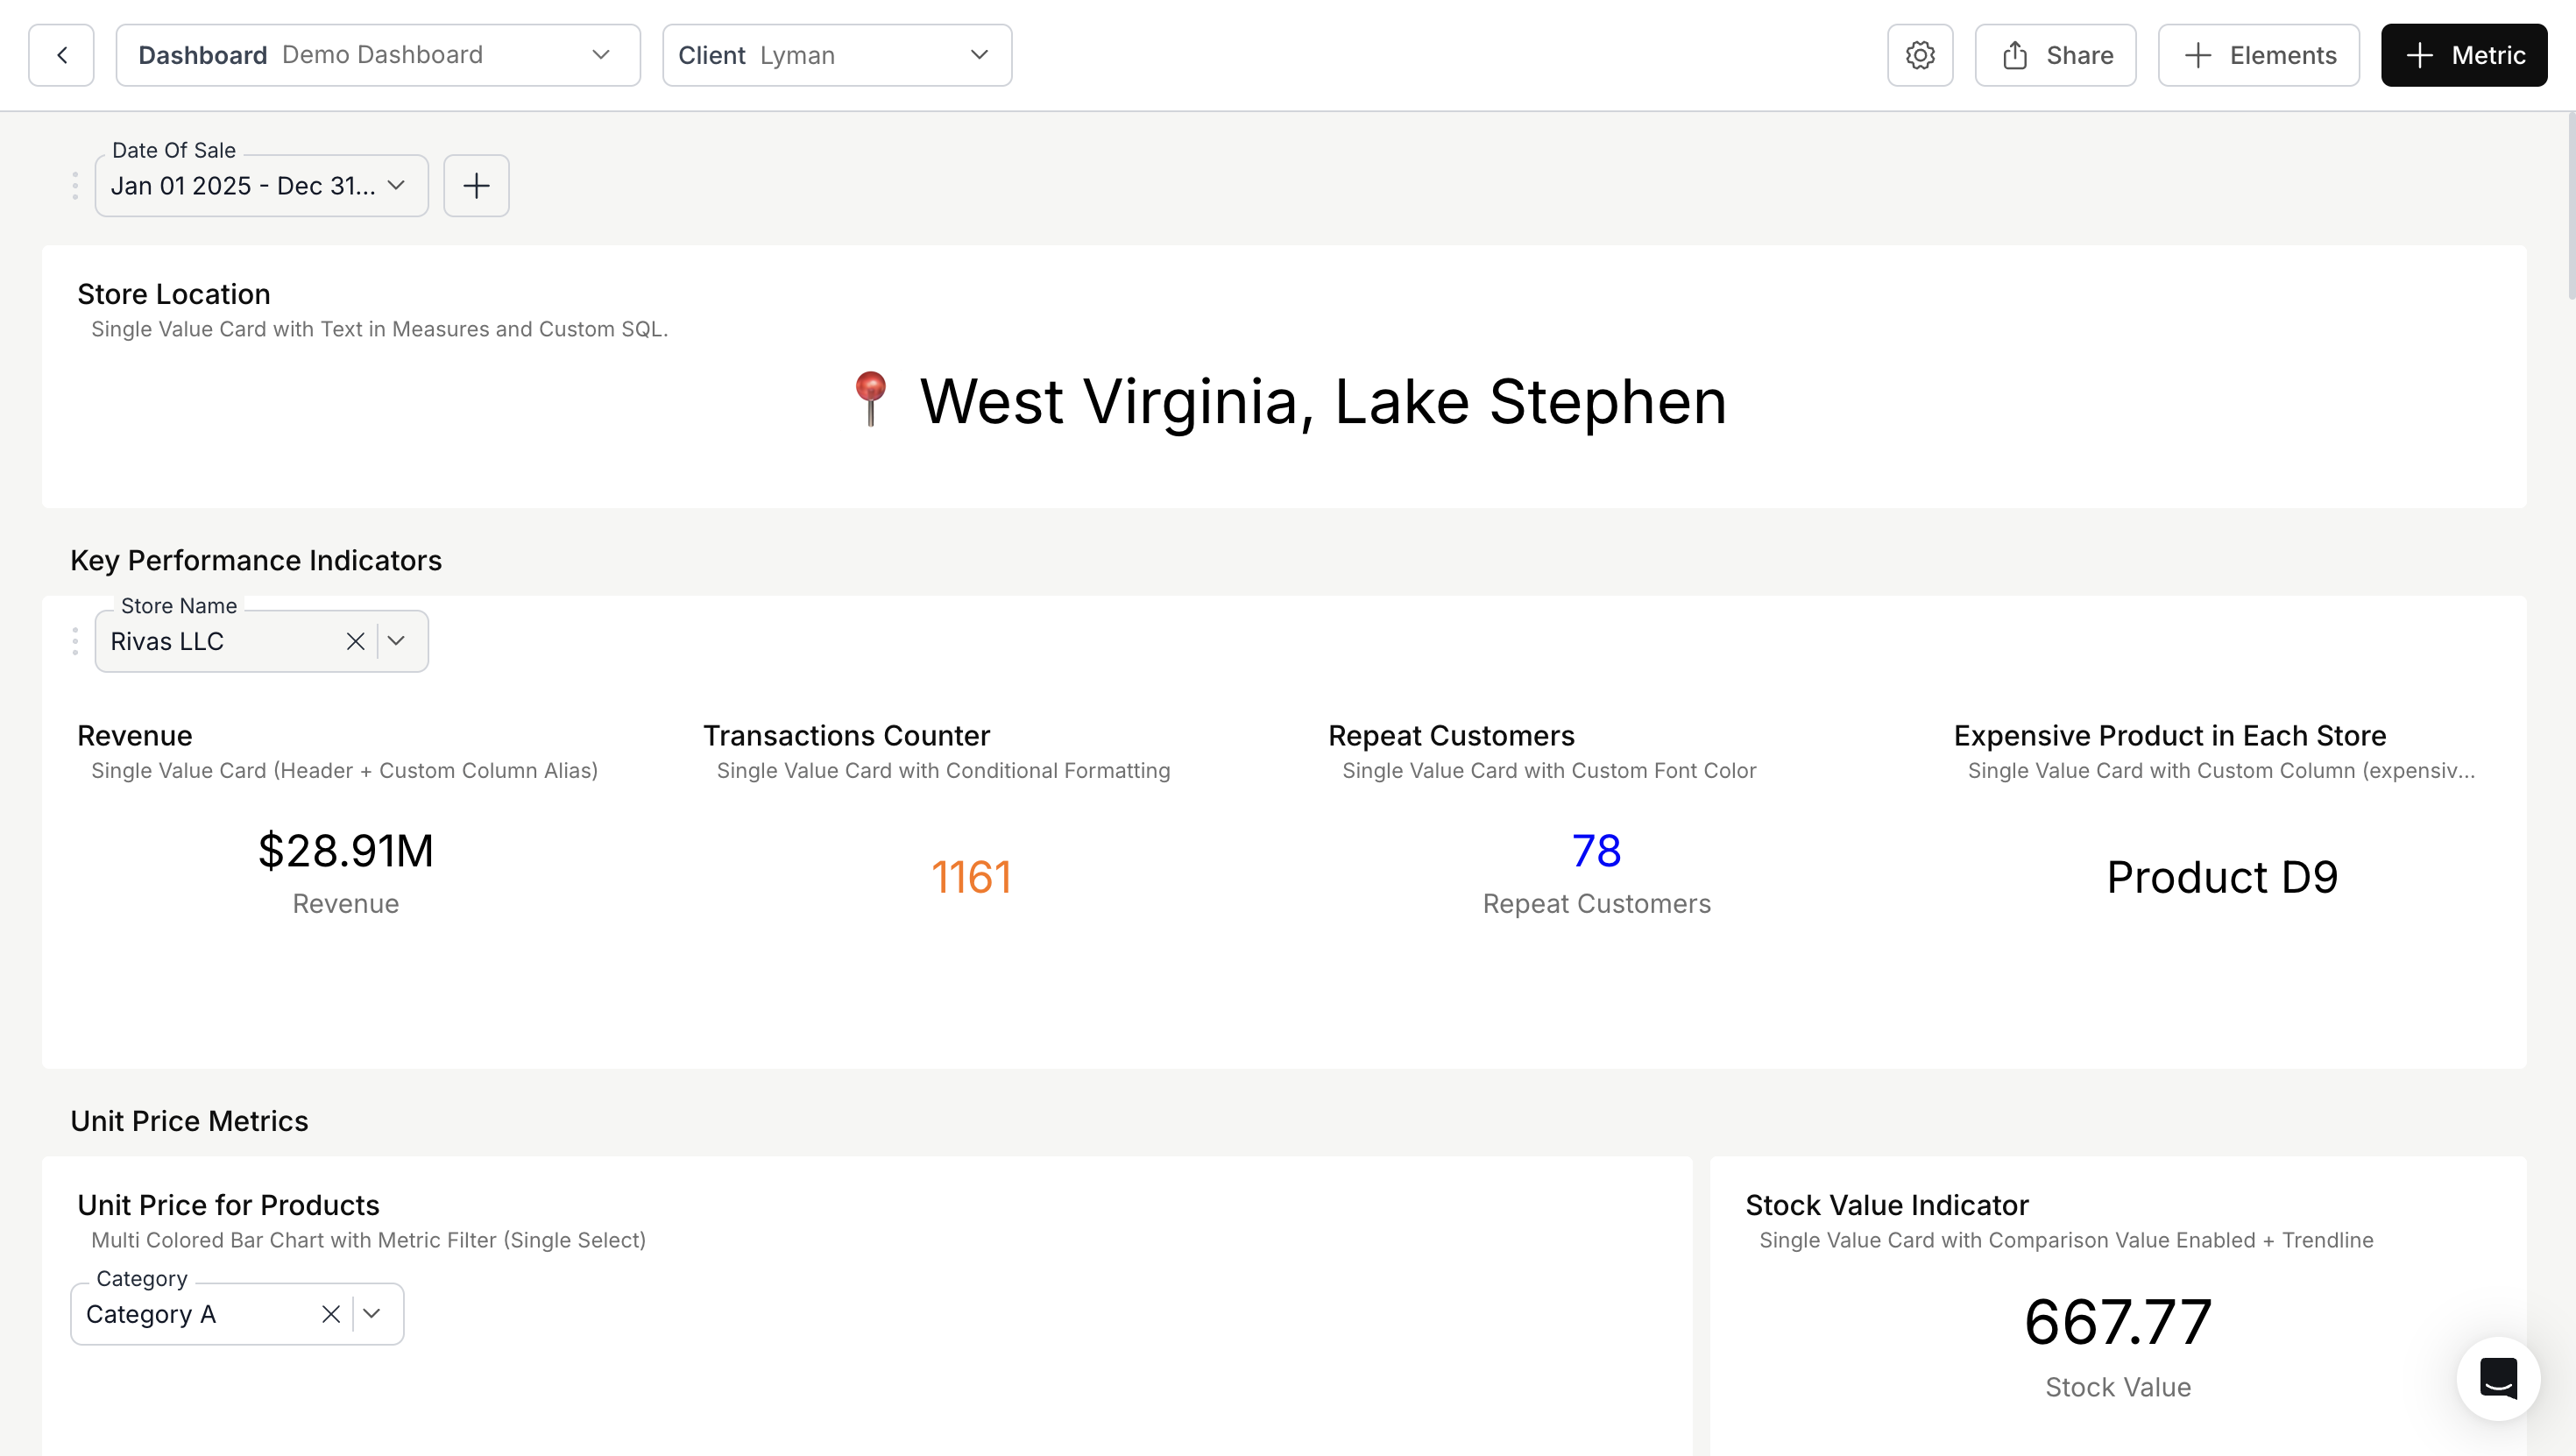
One dashboard can serve many contexts: different regions, roles, or “slices” of the same data. DataBrain supports this with section filters, saved view presets, and cross-dashboard drill-down. This post shows when and how to use each so the same dashboard behaves like multiple context-specific views without building separate dashboards.
When this helps: Use these features when you have one dashboard that different teams or roles use (e.g. sales vs support), when you want to offer one-click "views" (e.g. Q4 vs YTD, or by region), or when you want a click on a chart to drive the rest of the dashboard (or another dashboard) to the same context. No extra dashboards or duplicate metrics are required.
What you'll need: A DataBrain workspace with at least one dashboard and some metric cards. For section filters you'll use Merge Metrics (layout); for saved views you need View Filter (or equivalent) enabled on the dashboard; for drill-down you'll configure Actions on at least one metric. No code or database changes are required.
1. Section filters: one dashboard, multiple filter contexts
What they are: When you group metric cards into sections (via Merge Metrics in the layout), you can attach dashboard filters to a section. Those filters then apply only to the metrics inside that section. Any dashboard filter you've already added (e.g. Region, Product, Date) can be assigned to a section so it only affects the cards in that block.
How it behaves: Filters that are not assigned to a section typically remain global: they affect every metric that uses them. Once you assign a filter to a section, only the metrics in that section see that filter. So you can have a global "Date range" plus a "Sales" section that uses Region and Product, and a "Support" section that uses Team and Priority—without the support charts ever being limited by Region or Product.
Use cases:
- Sales vs Support: One dashboard with a “Sales” section (filters: Region, Product, Deal Stage) and a “Support” section (filters: Team, Priority, Channel). Each section has its own filters; changing “Region” doesn’t affect Support.
- By role or segment: E.g. “Executive” section (high-level KPIs + Region/Time) and “Operations” section (detailed metrics + Warehouse/Shift). Same dashboard, different filter sets per section.
- By data domain: E.g. "Marketing" (Campaign, Channel) and "Finance" (Account, Cost center) on one page so each team sees only the filters that matter to them.
- Product vs customer view: A "Product performance" section (filters: Product line, SKU) alongside a "Customer health" section (filters: Segment, Account tier). Product managers and customer success see the same dashboard but with filters tuned to their questions—no need to scroll past irrelevant controls.
How to set it up:
- Open the dashboard and go to Dashboard Settings (top right) → Customize Layout.
- Use Merge Metrics to create or edit sections and place metric cards inside them.
- In the Merge Metrics dialog, choose the dashboard filters you want for that section and save.
- Save the layout and Publish so section filters are visible to viewers.
Result: filters at the top (or in the filter panel) that are scoped to a section only affect the cards in that section. Global dashboard filters (if any) still apply everywhere; section filters add or narrow context per block. You can have multiple sections in a single layout (e.g. one row for Sales, one for Support), each with its own filter set, so the same dashboard serves different audiences without confusion.
Tip: If a filter doesn't appear in the section's list, ensure it exists as a dashboard filter first. Only dashboard-level filters can be attached to sections; metric-only filters stay on the metric.
Common pattern: Combine a global date range (so everyone sees the same time window) with section-specific dimensions. That way, "Last 30 days" applies everywhere, but Sales sees Region/Product while Support sees Team/Priority. The date filter keeps the comparison fair; section filters keep each block focused.
2. Saved view presets (View Filter)
What they are: DataBrain can store named filter presets for a dashboard: not only which filter values are selected, but also per-metric filter state and axis settings (e.g. which dimension is on the x-axis). So “Q4 view,” “West region,” or “Product breakdown” can be one-click presets. Switching views restores that exact snapshot—filters and chart configuration—so users don't have to reconfigure the dashboard each time.
What’s saved:
- Dashboard-level filter values (the main filter bar).
- Metric-level filter values per card (metricViewFilters).
- X-axis and y-axis settings per card (e.g. which field is on the x-axis).
That means a view can capture not just "Region = West" but also "revenue by product on the x-axis" and "last 90 days" so the whole analysis context is preserved.
Use cases:
- Time slices: "Last 30 days," "This quarter," "FY2024" as saved views. Especially useful when you pair a date filter with a specific axis or breakdown (e.g. "Q4 – by product").
- Regional views: "Americas," "EMEA," "APAC" with the right defaults and axis setup. One click and the dashboard is tuned for that region.
- Analysis modes: "By product" vs "By customer segment" with different dimensions on the axes and the right filters applied. Great for steering the same dashboard toward product managers vs customer success.
- Review cadences: "Weekly review," "Monthly board pack," "Ad-hoc deep dive" so stakeholders can jump to the view that matches the meeting.
- Persona shortcuts: "CFO view" (revenue, margins, cash; minimal dimensions) vs "Ops view" (throughput, SLAs, by warehouse). Named by who uses them, not just by filter values—helps onboarding and reduces "where do I find X?" questions.
How to use:
- Enable View Filter (or “Filter view” / saved views) for the dashboard in dashboard settings if it’s not already on (this option may vary by plan or workspace settings).
- Set filters and axis options the way you want for a given “view.”
- Save as a new view and give it a name (e.g. “Q4 – West”).
- Users switch views from the view dropdown; filters and axis settings restore to that snapshot.
This keeps one dashboard while giving many “modes” without rebuilding layout or metrics. Naming views clearly (e.g. "Q4 summary" vs "Q4 by product") helps users pick the right one quickly.
Tip: Don't over-create views. A handful of well-named presets (e.g. 3–5) is usually better than a long list that's hard to scan. Prefer views that match real workflows (e.g. "Board pack," "Regional review") rather than every possible filter combination.
3. Cross-dashboard drill-down
.gif)
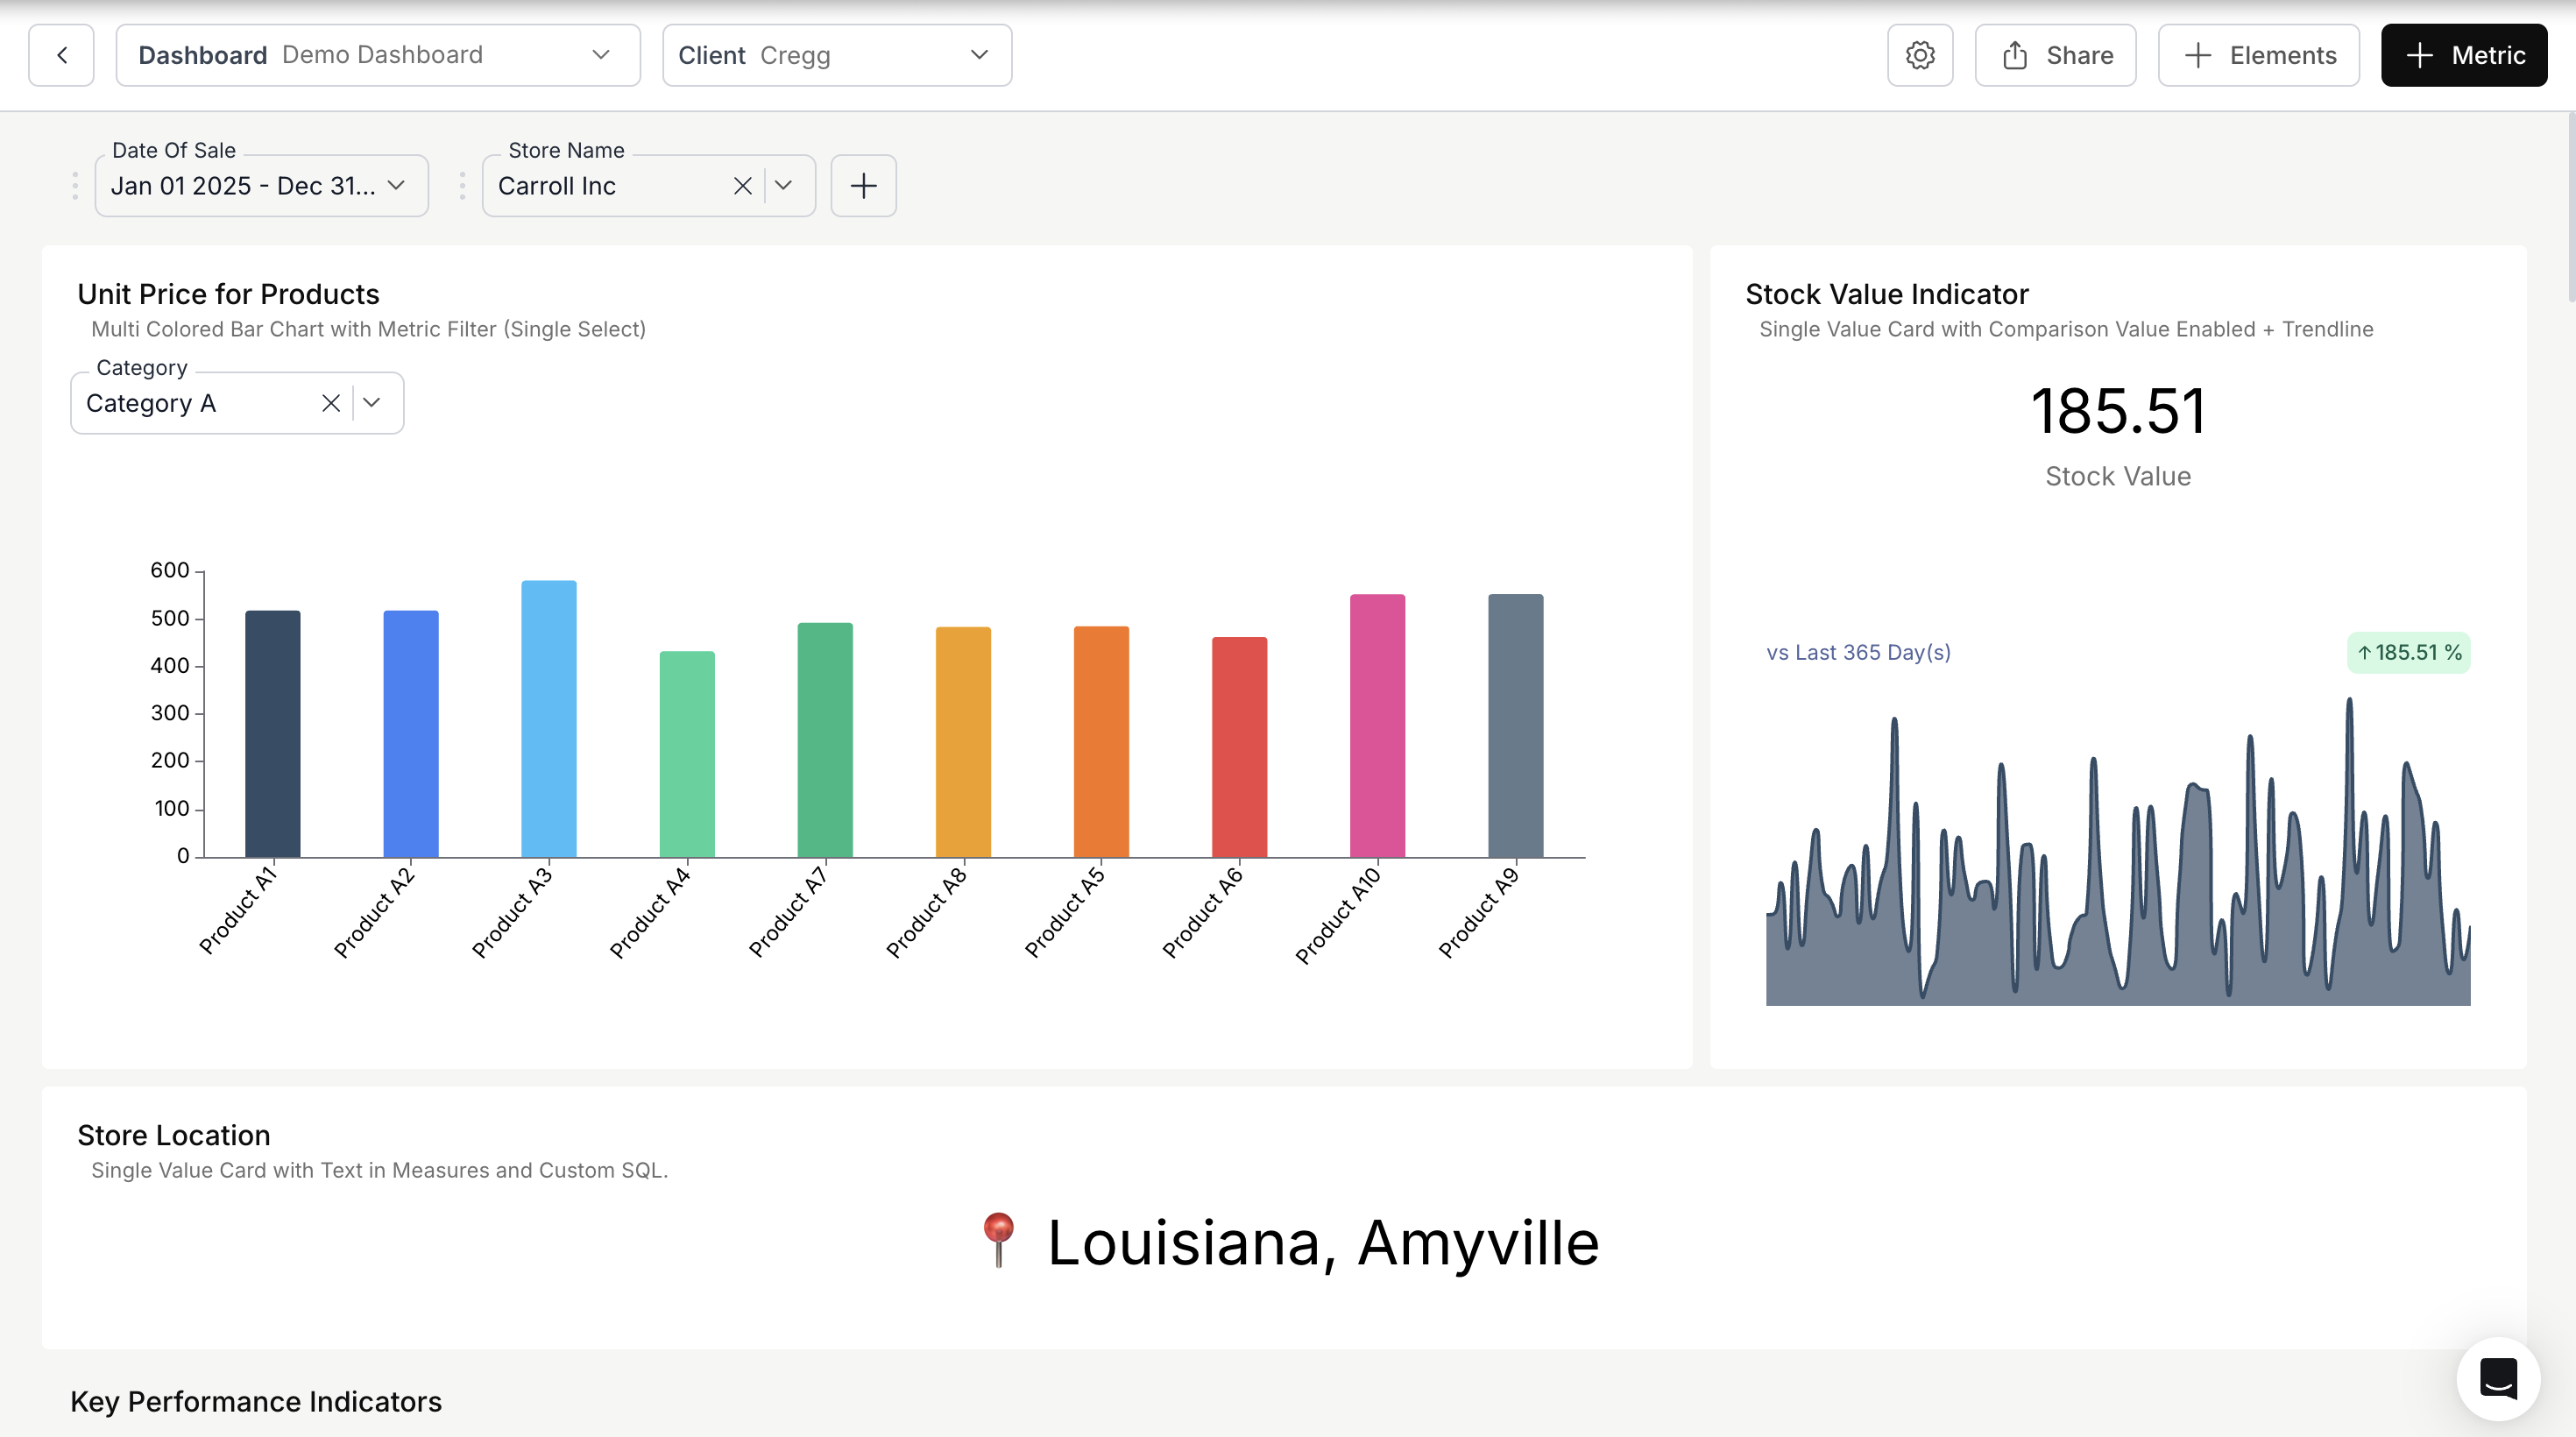
What it is: From a metric card, users can drill down on a dimension (e.g. click a segment or a row). With cross-dashboard drill-down enabled, that drill-down can apply to the whole dashboard (or navigate to another dashboard), so the rest of the dashboard updates to the same context (e.g. same region, same product). The clicked value is passed as a filter (or set of filters) to the target, so the rest of the view is in sync with what the user selected.
Same dashboard vs another dashboard: You can configure drill-down so that (a) the current dashboard's filters update to the clicked value (e.g. click "West" → entire dashboard shows Region = West), or (b) the user is taken to another dashboard with that value pre-applied (e.g. click a product → "Product detail" dashboard opens with Product = X). Both patterns keep context consistent; choose based on whether the next step is "narrow this dashboard" or "open a dedicated detail view."
Use cases:
- Consistent context: User clicks “West” in a chart; the entire dashboard filters to “Region = West” so every card shows West only. No need to find and set the Region filter manually.
- Drill from summary to detail: Summary dashboard → click a segment → same or another dashboard opens with that segment pre-applied (e.g. “Product = X”) for deeper analysis.
- Role-based flow: E.g. exec dashboard shows regions; clicking a region opens a regional dashboard with that region already selected so the regional manager lands in the right context.
How to set it up:
- On the metric that will trigger the drill, open Settings → Actions.
- Enable Drill down and then Cross Dashboard Drill Down (or equivalent in your UI).
- Configure what gets passed on drill (e.g. which dimension and value become a filter on the target). Ensure the target dashboard (or same dashboard) has a filter that can accept that dimension.
- When the user clicks a data point or segment, the dashboard (or target dashboard) receives that context and applies it so the view is consistent.
Result: one click carries the user’s context (e.g. region, product, time) across the same dashboard or to another one, so the experience feels like “one flow” instead of separate screens.
Tip: The dimension you drill on (e.g. Region, Product) must exist as a filter on the target. If the target dashboard doesn't have a matching filter, the drill can still open the dashboard but the value may not be applied—so align drill configuration with the target's filters.
Drill-down and sections: When drilling to the same dashboard, the applied filter (e.g. Region = West) affects every metric that uses that dashboard filter. Metrics in sections that don't use Region won't change—which is correct when you've deliberately scoped filters by section. If you want the drill to affect only one section, ensure the target filter is section-scoped; if you want it to affect the whole dashboard, use a global filter. Plan your section vs global filter assignment with drill-down in mind.
When to use which
Tips and caveats
- Section filters and global filters: If you use both, remember that global filters apply to all metrics; section filters add (or restrict) context only for that section. Plan which filters should be global (e.g. Date) and which should be section-specific (e.g. Region for Sales, Team for Support).
- Saved views and section filters: Saved views capture the current state of both global and section-scoped filters. So a view like "West – Sales" can store Region = West and the Sales section's Product selection; when users switch to that view, both are restored.
- Drill-down and section filters: When a user drills and the target is the same dashboard, the applied filter (e.g. Region = West) will affect every metric that uses that dashboard filter. If some metrics are in sections that don't use Region, those cards won't change—which is often what you want when sections are set up for different audiences.
- Publishing: Layout and filter changes (including section filter assignment) require saving and Publishing the dashboard before viewers see them. Saved views and drill-down configuration also need to be published.
Putting it together: one dashboard, many contexts
Scenario: A single "Sales & Operations" dashboard should serve regional managers (filter by region and product), product leads (filter by product, view by segment), and execs (high-level KPIs, optional region, with one-click time views). No duplicate dashboards.
Setup:
- Sections: Use Merge Metrics to create two sections: "Regional view" (metrics that regional managers care about) and "Product & segment" (product and segment-level metrics). Attach the Region and Product dashboard filters to the "Regional view" section only, and Product and Segment to the "Product & segment" section. Add a global Date range filter so everyone can narrow by time. Now changing Region doesn't affect the Product & segment section, and vice versa.
- Saved views: Create a few named views: "Q3 summary" (date = Q3, default axes), "Q4 summary" (date = Q4), "By product" (x-axis = product where relevant), "By segment" (x-axis = segment). Execs and product leads can switch to "Q4 summary" or "By product" in one click.
- Drill-down: On the "Regional view" section's main chart (e.g. revenue by region), enable cross-dashboard drill-down on the Region dimension, targeting the same dashboard. When a regional manager clicks "West," the whole dashboard's Region filter switches to West so all cards in that section (and any global Region usage) update. Optionally add a second drill that opens a "Region detail" dashboard with the clicked region pre-applied.
Result: the same dashboard serves regional managers (section filters + drill), product leads (section filters + "By product" view), and execs (saved views + optional region). One layout, one set of metrics, multiple context-aware experiences.
Summary
- Section filters: Attach dashboard filters to a section (Merge Metrics). Only metrics in that section use those filters. Good for “one dashboard, multiple contexts” by block.
- Saved view presets: Save current filter values + per-metric filters + axis settings as a named view. Good for “Q4,” “West,” “By product,” etc., without new dashboards.
- Cross-dashboard drill-down: Click a dimension value on a card → that context is applied to the whole dashboard (or another dashboard). Good for consistent, click-through analysis.
Together, these make a single DataBrain dashboard behave in a context-aware way for different users, regions, and analyses.
Related:
- Conditional analytics in DataBrain (scope, AND/OR, dependents)
- AND-style multi-select filters — for AND logic across multiple values in a single filter (e.g. when a section filter uses a multi-select that must match all selected values).
- Merge Metrics (section filters), Section filters, and Cross-dashboard drill-down in the DataBrain docs.


