

.png)
Procurement is a core function of every business — from managing suppliers and contractors to tracking invoices, compliance, and delivery timelines. Yet most of this data lives in disconnected spreadsheets and siloed systems, making visibility limited and decision-making painfully slow. The problem isn’t the lack of data; it’s the lack of intelligence. Traditional BI dashboards can show procurement numbers, but they rarely explain what those numbers mean or why they matter.
That’s where Databrain comes in. By combining Datamarts to unify fragmented data, a Semantic Layer that makes the data meaningful: translating technical fields into business-friendly terms, defining relationships like supplier-to-invoice or order-to-delivery, standardizing metrics for one version of the truth, validating models before adoption, and preparing data for natural-language queries, Chat Mode to query data in plain language, and AI-powered summaries to explain trends, Databrain makes it seamless to build dashboards that move procurement teams from reporting to real intelligence.
In this blog, we’ll walk through that journey step by step – showing how to create an AI-powered procurement dashboard that helps leaders move faster, see clearer, and decide smarter.
From Fragmented Data to a Datamart Foundation
One of the biggest frustrations for procurement teams is chasing data across multiple systems – supplier lists in one spreadsheet, invoices in another, compliance checks in a third. This fragmentation delays analysis and erodes trust in reports.
Databrain addresses this with a Datamart, a structured analytical layer that centralizes raw data into one reliable foundation. Whether it’s supplier contracts, operational logs, or cost breakdowns, Datamart ensures procurement teams always work with clean, consolidated data.
👉 Learn how Databrain Datamarts work
Speaking the Language of Procurement with the Semantic Layer
Once data is centralized, procurement leaders need to turn it into meaningful insights. While procurement data may be structured, it is often hidden behind technical field names such as totalexpense or incidenttype. Without translation, these fields can be difficult for business users to interpret.
Databrain’s Semantic Layer bridges this gap. It doesn’t just rename fields — it standardizes vocabulary, governs relationships, and provides a safe environment to test and validate how the model behaves before dashboards consume it.
Key capabilities of the Semantic Layer (and why they matter for procurement):
- Business vocabulary & discoverability: Add table and column synonyms so stakeholders can search and work with familiar procurement terms. For example:
- totalexpense → Procurement Expenditure
- customerrating → Supplier Performance Score
- incidenttype → Procurement Delay Factor
- totalexpense → Procurement Expenditure
- Trusted joins: Define relationships and cardinality (e.g., one-to-many) across tables so analyses reflect real-world procurement scenarios like supplier-to-invoice or order-to-delivery mappings.
- Consistent metrics & questions: Create reusable definitions and analytical questions (e.g., Total Spend, On-time Delivery Rate) that can be used — ensuring one version of the truth. These definitions standardize calculations, and ensure consistency across reports.
- Model validation & quality: Use the Lab to run synthetic queries, inspect logs from chat interactions, and set evals to verify the semantic model before wider adoption.
- LLM readiness: Use the Playground to test how natural-language prompts resolve against the model, refining synonyms and definitions to ensure smooth chat-driven analytics.
- Curated examples: Publish a Sample Set to provide representative procurement data for experimentation, onboarding, and documentation.
This ensures dashboards communicate in the language of procurement, making exploration intuitive and reliable—without requiring SQL or database expertise.
Chat Mode
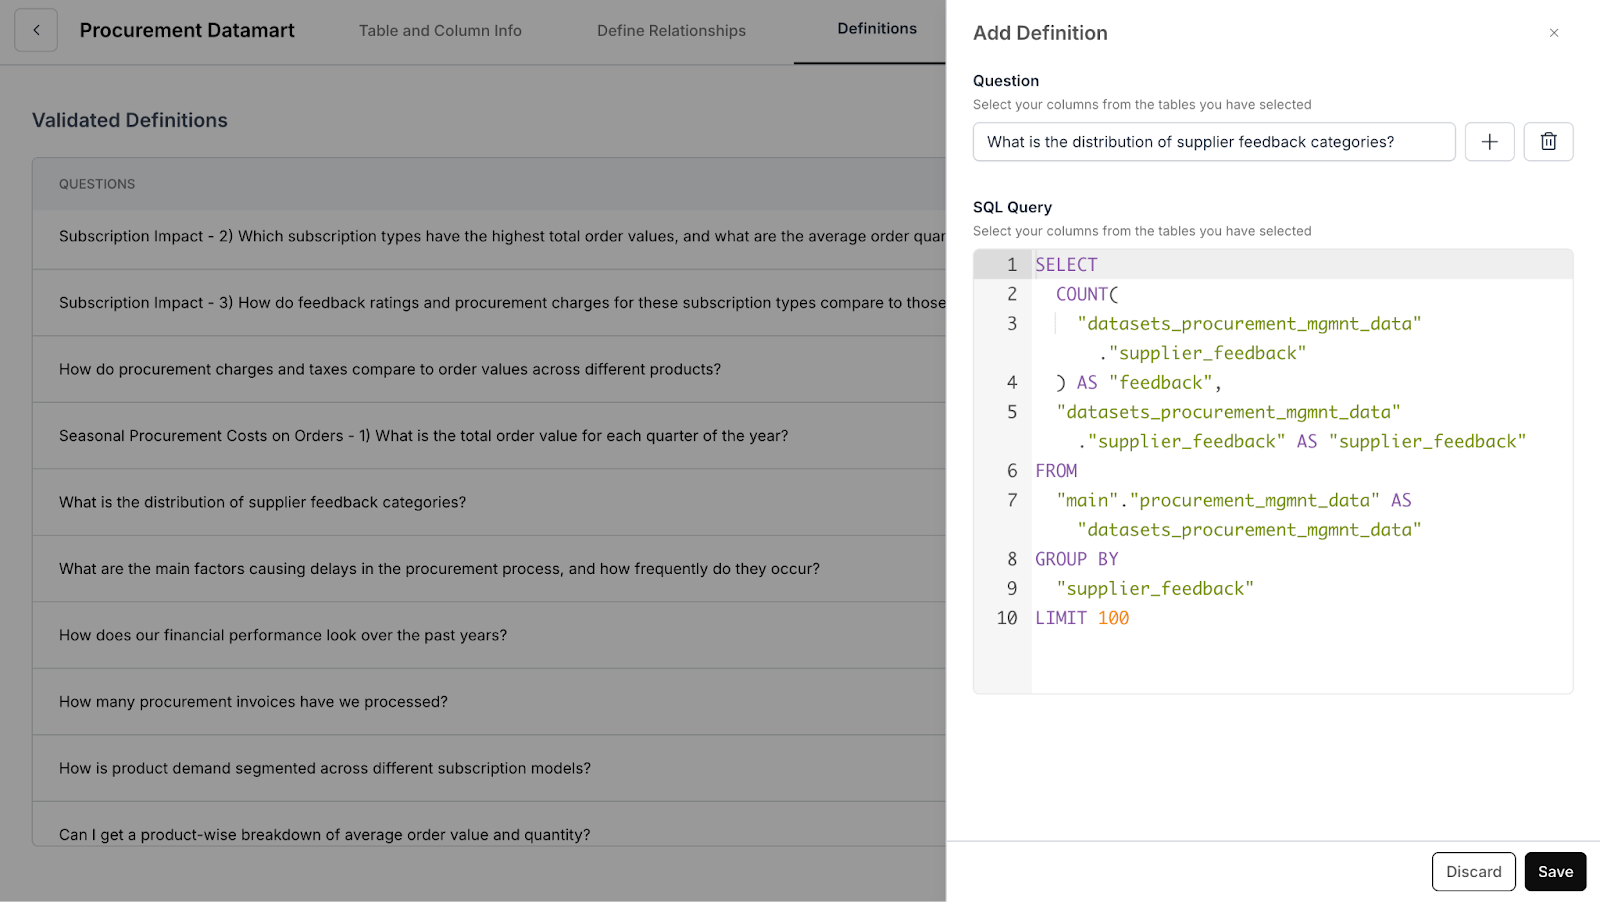
Now that your procurement data is structured and business-ready, you can interact with it naturally using Chat Mode. Procurement leaders shouldn’t need to write SQL queries in order to access the insights they require. With Databrain Chat Mode, they can bypass technical complexity and interact with data in plain language.
Instead of composing queries, users can simply ask questions such as:
- “How many unique suppliers are we currently working with?”

- “What is the distribution of supplier feedback categories?”

Databrain automatically interprets these questions, generates the underlying queries, and presents the results as reusable metrics. These metrics can then be incorporated directly into dashboards, ensuring consistency and reducing time-to-insight.
This approach provides a no-code, natural-language interface for analytics, making advanced reporting accessible to procurement teams across all levels.
Building the Dashboard
Once metrics are defined, organizing them into meaningful sections makes the dashboard come alive — turning it into a tool procurement leaders can rely on every day. In Databrain, you can arrange metrics into sections such as:
- Supplier Ecosystem → Total Suppliers, Total Contractors, Supplier Performance Score
- Financial Pulse → Overall Procurement Expenditure, Complete Invoice Tally, Cost Savings Deliveries

- Order & Operations → Procurement Delay Factors Overview
- Strategic Analysis → Revenue vs. Expenditure

Each metric automatically syncs with the semantic layer, ensuring consistency across the dashboard.
From Charts to Insights: The AI Edge
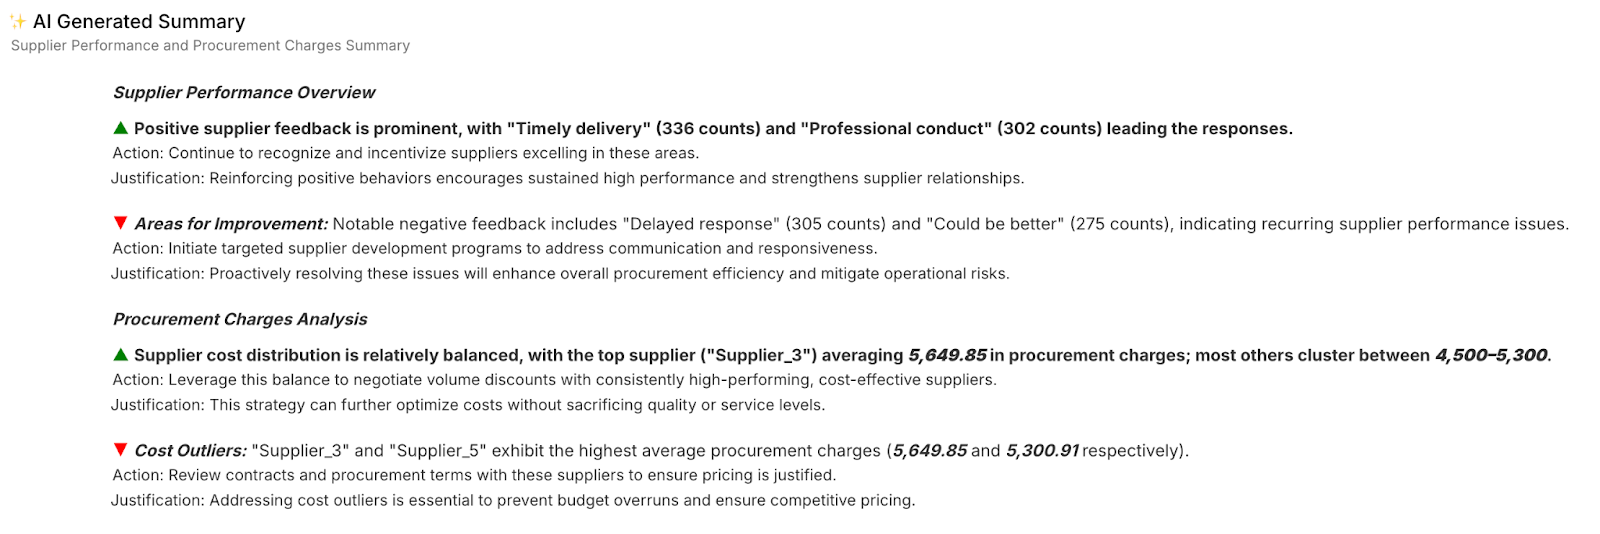
Numbers and charts show what’s happening, but procurement leaders also need to know why it matters.
This is where Databrain’s AI-powered summaries shine. Databrain’s Metric AI Summary feature automatically generates narrative insights such as:
- “Overall procurement expenditure increased by 8% this quarter.”
- “Compliance rate remains strong at 94%, with Supplier A leading performance.”
- “Major delays are concentrated in Region Y due to logistics issues.”
These AI narratives transform dashboards from static reports into decision-making assistants.
👉 Learn about Metric AI Summaries
Outcome: From Reporting to Intelligence
With Databrain, procurement dashboards evolve beyond visualization into living systems of intelligence.
The result:
- Transparency into supplier performance and spend.
- Agility in identifying risks before they escalate.
- Confidence in decisions backed by AI-generated insights.
Instead of chasing spreadsheets across fragmented systems, procurement teams can focus on making smarter, faster decisions.
Frequently Asked Questions
How does Databrain's Semantic Layer make procurement data more accessible to business users?
Databrain’s Semantic Layer translates technical field names like ‘totalexpense’ into business-friendly terms like ‘Procurement Expenditure,’ defines relationships between data tables, and sets standardized calculations so everyone works from the same metrics.
What makes Databrain different from traditional BI dashboards?
Unlike traditional dashboards that only show numbers, Databrain combines a Semantic Layer for business-friendly terms, Chat Mode for natural language queries, and real-time AI insights, making procurement data accessible to non-technical users without SQL knowledge.
Can non-technical users query procurement data without SQL?
Yes, with Chat Mode users can ask questions in plain language like ‘How many suppliers do we work with?’ and Databrain automatically generates queries, returns visual answers, and suggests follow-up questions.


