.png)
.png)
Stop Rebuilding Dashboards Just to See Another View
You’ve seen this play out a hundred times.
Someone on your team opens a dashboard, maybe the company’s sales dashboard, and starts filtering.
They pick Asia, then Electronics.
A few minutes later, someone else wants to see Europe, Clothing.
Now they have to reset every filter, reapply, and wait for the charts to load.
By the end of the day, half the team is maintaining sticky notes of “filter combinations” just to remember what to click.
That’s exactly the kind of waste DataBrain’s Boards feature eliminates.
From My Own Dashboard Headache
When I was an analyst at my previous company, I used to send the same dashboard to different people every day.
Each stakeholder wanted their own version: a specific region, category, or time range.
I’d spend hours tweaking filters, exporting views, and double-checking that I hadn’t missed one tiny parameter.
If I had Boards back then, it would’ve saved me a ton of redundant filter selections and manual upkeep.
One click, and each person could’ve had their own saved view.
That’s the idea behind Boards , to remove that friction for every analyst, manager, or customer who works with dashboards daily.
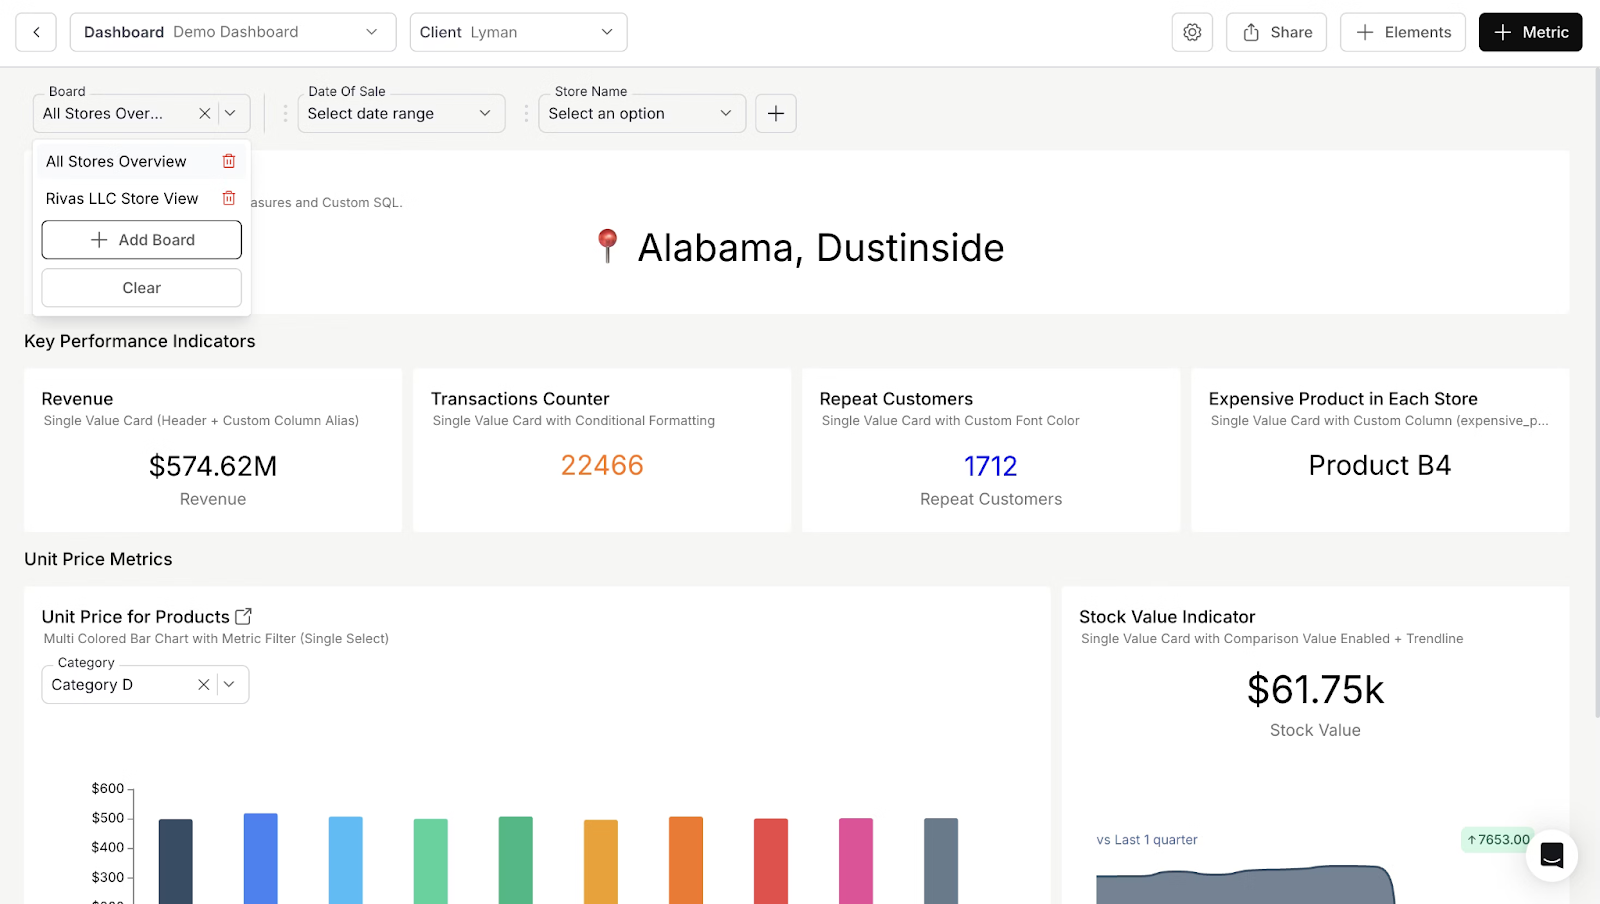
What Are Boards
A Board is a saved view of your dashboard.
It captures all your filters and axis selections so you can name, save, and switch between them in a click.
It’s the simplest way to stop re-filtering the same dashboard over and over.
Take a Sales Performance Dashboard, for example.
You can create one board for Asia Electronics, another for Europe Clothing, and another for North America Automotive.
Each board remembers its own filter setup: geography, category, product line, so when a regional manager logs in, they just click their board and the dashboard instantly updates.
No manual reconfiguration. No wasted time. No second guessing.
The Pain It Solves
Dashboards are powerful, but power often brings friction.
As filters multiply, so does the effort needed to use them.
Every time you switch context, you repeat the same process:
- Re-select filters
- Wait for the dashboard to reload
- Hope you didn’t miss one
It’s tedious, easy to mess up, and it interrupts your flow.
Once you’ve set your filters the way you like, just save them as a board. Next time, you don’t start from scratch, you pick your setup and you’re right back where you left off.
Want to compare Q2 Asia Electronics with Q3 Europe Clothing? Click, switch, done. It feels like toggling views, not rebuilding them.
How It Works
- Create once: Filter your dashboard exactly how you want it.
- Save as board: Give it a clear name like “EMEA Performance” or “Enterprise Clients Q1.”
- Reuse instantly: Switch between boards without touching a single filter.
There’s no limit to how many boards you can create for a dashboard.
Each one is personalizable, shareable, and works wherever your dashboard does, even inside embedded analytics.
So if your dashboards are embedded in your client portal or SaaS app, your end users get the same convenience.
They can save and reuse boards just like your internal teams.
Why It Matters
Because time spent re-filtering dashboards isn’t analysis. It’s admin work.
Boards give that time back to your team. They make dashboards adapt to each user’s point of view, whether it’s:
- A product manager tracking adoption by region
- A sales director comparing vertical performance
- A customer exploring their own data in your embedded analytics portal
Everyone gets a personalized, ready-to-use entry point.
Switching perspectives becomes as simple as switching tabs.
Beyond Convenience: Collaboration and Discovery
Boards also make teamwork faster.
You can share boards with your team, so everyone’s looking at the same version of truth, literally the same filters and axes applied.
No more “wait, what filters are you using?” moments.
Everyone’s board becomes a consistent, reusable view.
And when you’re exploring data, boards quietly enable discovery.
You can move between hypotheses in seconds: “What if we isolate Europe?” or “What happens if we exclude SMB clients?”, without rebuilding the setup.
In Plain Terms
Without boards, you’re rebuilding dashboards every time you change focus.
With boards, you’re switching between saved setups like flipping between tabs in your browser.
One-time setup. Infinite reusability.
That’s the essence of how DataBrain builds analytics that flex to how people actually work.
Key Takeaways
Boards let you tailor a single dashboard for different audiences without rebuilding or duplicating it.
You can create and save your own filter setup without changing what anyone else sees, so each person can work from their own view.
You can also curate and share specific boards with your team to make sure everyone’s looking at the same perspective when discussing results.
It’s an easy way to create multiple, personalized data stories from the same dashboard, whether you’re a manager tracking performance, an analyst exploring trends, or a customer using an embedded dashboard.
Set it once, save it as a board, and come back to it anytime.
Try Boards in DataBrain Today
Set your filters once. Save them as boards.
Switch, compare, and collaborate effortlessly.


