
In the dynamic world of SaaS, data is your roadmap to clarity and confidence.
This playbook equips you with ready-to-use SQL queries for the metrics that drive growth, retention, and profitability.
No need for advanced technical skills—just adapt the table and column names to your database, and let the insights unfold.
How to Use This Playbook
- Choose your metric.
Find the metric that answers your most pressing questions. - Copy the SQL.
Swap in your own table and column names. - Run it in your database tool.
Watch as the numbers reveal your business’s story.
Industry Benchmarks & Standards
Your Data Foundation
These tables are the pillars of your SaaS analytics:
- main.saas_data_clients: The foundation of every client relationship.
- client_id, client_name, created_at
- main.saas_data_customers: Every user’s journey, captured in detail.
- customer_id, client_id, customer_name, signup_date, is_active
- main.saas_data_plans: Your product’s menu of options.
- plan_id, client_id, plan_name, monthly_price, annual_price, is_active
- main.saas_data_subscriptions: Captures the full lifecycle: sign-ups, renewals, and cancellations.
- subscription_id, client_id, customer_id, plan_id, start_date, end_date, status
- main.saas_data_payments: The flow of revenue through your business.
- payment_id, client_id, customer_id, subscription_id, amount, payment_date, is_refund
- main.saas_data_events: The story of every login, upgrade, and farewell.
- event_id, client_id, customer_id, event_type, event_date, is_churn
- main.saas_data_costs: The price of delivering value to your customers.
- cost_id, client_id, customer_id, cost_type, cost_amount, cost_date
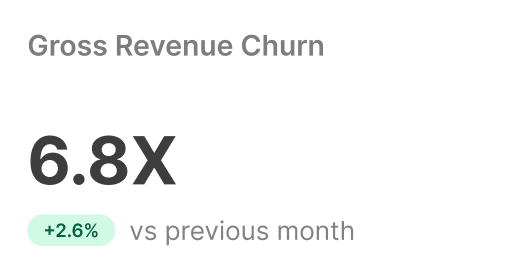
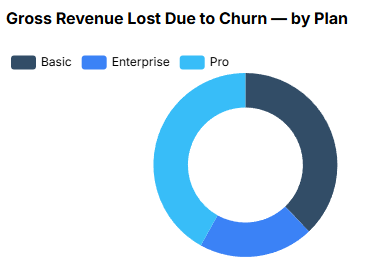
Gross Revenue Churn
Gross Revenue Churn reveals the financial impact of lost customers and downgrades — not just who leaves, but how much recurring revenue walks out the door with them. It’s the monetary echo of each cancellation or downgrade. Keeping this number low means your customers see lasting value in your product, driving stronger loyalty and more predictable revenue streams. Monitoring Gross Revenue Churn helps you protect your recurring income and spot early signs of dissatisfaction before they grow.
Visualization Ideas:
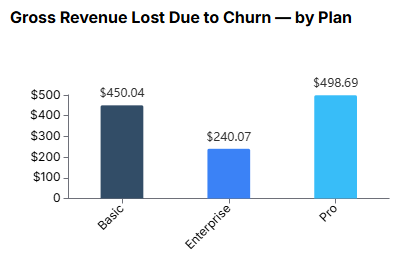
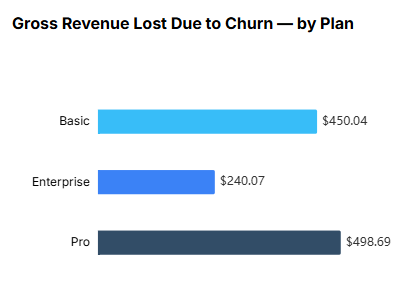
- Bar Chart: See which plans are losing the most revenue.
- Alert Widget: Flag high-churn plans for immediate attention.
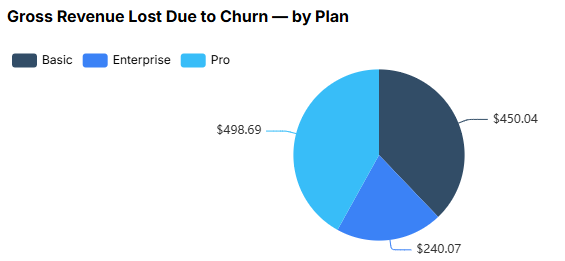
- Pie Chart: Shows part-to-whole breakdown of gross revenue lost due to churn by plan
- Donut Chart: Displays gross revenue lost due to churn by plan
Implementation Checklist
- Define your metrics and add them to a data dictionary.
- Ensure your database schema supports the required calculations.
- Write and test SQL queries for each metric.
- Import results into your BI tool. Get started with DataBrain today!
- Build and share dashboards with stakeholders.
- Schedule regular reviews and updates.
Unlock the power of your data.
Start using this SQL Playbook today!
“In the world of SaaS, data is everyone’s responsibility. With this playbook, anyone can own their metrics and drive better outcomes.”
Now, simply run the SQL queries on your data and unlock the power of your SaaS analytics!
