
In the dynamic world of SaaS, data is your roadmap to clarity and confidence.
This playbook equips you with ready-to-use SQL queries for the metrics that drive growth, retention, and profitability.
No need for advanced technical skills—just adapt the table and column names to your database, and let the insights unfold.
How to Use This Playbook
- Choose your metric.
Find the metric that answers your most pressing questions. - Copy the SQL.
Swap in your own table and column names. - Run it in your database tool.
Watch as the numbers reveal your business’s story.
Share the insights.Empower your team with data-driven decisions.
Industry Benchmarks & Standards
Your Data Foundation
These tables are the pillars of your SaaS analytics:
- main.saas_data_clients: The foundation of every client relationship.
- client_id, client_name, created_at
- main.saas_data_customers: Every user’s journey, captured in detail.
- customer_id, client_id, customer_name, signup_date, is_active
- main.saas_data_plans: Your product’s menu of options.
- plan_id, client_id, plan_name, monthly_price, annual_price, is_active
- main.saas_data_subscriptions: Captures the full lifecycle: sign-ups, renewals, and cancellations.
- subscription_id, client_id, customer_id, plan_id, start_date, end_date, status
- main.saas_data_payments: The flow of revenue through your business.
- payment_id, client_id, customer_id, subscription_id, amount, payment_date, is_refund
- main.saas_data_events: The story of every login, upgrade, and farewell.
- event_id, client_id, customer_id, event_type, event_date, is_churn
- main.saas_data_costs: The price of delivering value to your customers.
- cost_id, client_id, customer_id, cost_type, cost_amount, cost_date
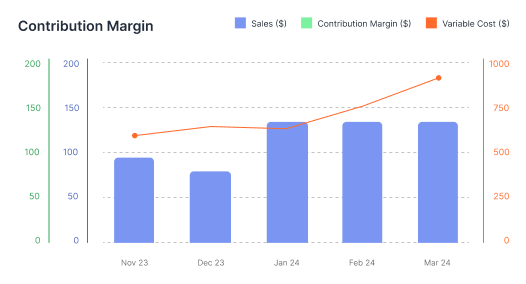
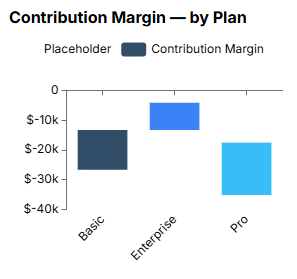
Contribution Margin
Contribution margin measures how much profit remains after covering the direct costs of serving your customers. Think of it as the fuel that powers your growth engine — the higher it is, the more resources you have to reinvest in product development, marketing, and expansion. A healthy contribution margin ensures your business isn’t just generating revenue, but turning that revenue into real, sustainable profit. Tracking it closely helps you make smarter pricing, cost management, and scaling decisions.
Visualization Ideas:
- Waterfall Chart: See how costs and revenue stack up.
- Scorecard: Highlight your most profitable plans.
Implementation Checklist
- Define your metrics and add them to a data dictionary.
- Ensure your database schema supports the required calculations.
- Write and test SQL queries for each metric.
- Import results into your BI tool. Get started with DataBrain today!
- Build and share dashboards with stakeholders.
- Schedule regular reviews and updates.
Unlock the power of your data.
Start using this SQL Playbook today!
“In the world of SaaS, data is everyone’s responsibility. With this playbook, anyone can own their metrics and drive better outcomes.”
Now, simply run the SQL queries on your data and unlock the power of your SaaS analytics!
