Procurement Dashboards: 11 KPIs & 8 Examples & Build vs Embed Guide (2026)
11 procurement dashboard KPIs (Spend, Supplier, Cycle) with formulas, 8 examples by audience, and an honest build-vs-embed framework for 2026.

.png)
Key Takeaways
- A procurement dashboard replaces scattered spreadsheets with one live view of spend, supplier performance, and contract compliance.
- 11 KPIs across Spend, Supplier, and Purchase Cycle categories cover most needs; pick 5 to 7 tied to current OKRs.
- Under 30% of dashboards survive past 90 days unless embedded inside a tool the team already opens daily.
- CPOs, category managers, and finance teams need different dashboard views, not one shared screen; 8 dashboard types by audience are covered below.
- Procurement-tech vendors face a different build-vs-embed decision than internal teams: 12-18 months and $2M-$3M to build versus days-to-weeks and $50K-$150K to embed.
By Vishnupriya B, Data Analyst at Databrain
What Is a Procurement Dashboard?
A procurement dashboard is a live visual layer on top of your purchasing data. It pulls spend, supplier performance, contract compliance, and cost savings into one screen with charts and KPI cards. No more digging through 14 tabs of a monthly spreadsheet report.
It's not the same as your ERP dashboard, which covers everything from HR headcount to revenue forecasting. It's also different from a spend analysis tool, which digs into historical purchasing patterns. Instead, a procurement dashboard zooms into the procure-to-pay lifecycle specifically: who's delivering on time, which contracts are about to lapse, and where budget is leaking right now.
Who pulls it up daily? CPOs tracking portfolio savings. Category managers watching supplier scorecards. Finance teams checking spend against budget. The views differ, but the underlying need is the same: data you can act on immediately, not a report you wait three days for someone else to build. (For how a dashboard differs from the broader analytics discipline behind it, see the FAQ below.)
Why Does Every Procurement Team Need a Dashboard in 2026?
Procurement teams that invest early in real-time data visibility pull ahead fast. Deloitte's 2025 Global Chief Procurement Officer Survey found that digitally mature procurement functions, what the report calls "Digital Masters," now allocate up to 24% of their budgets to technology, nearly double what they reported in 2023 (Deloitte, 2025). That gap shows up everywhere: in spend nobody can categorize, supplier issues nobody catches early, and savings nobody can prove to the CFO. A dashboard closes that gap in six specific ways.
1. Spend visibility across the organization
Most procurement teams still can't answer a simple question: where is the money going? A dashboard fixes this by surfacing spend by category, supplier, department, and geography in one place. No data requests, no waiting three days for an analyst to pull a report.
2. Real-time supplier performance monitoring
By the time you notice a supplier missing delivery windows for three months straight, the damage is already done: production delays, customer complaints, and scrambled workarounds. A dashboard with live performance scores catches the slide at week two, not month three. That's the kind of proactive vendor management that the broader supply chain analytics discipline makes possible.
3. Cost savings tracking and ROI proof
Seventy-two percent of sourcing and procurement leaders now say they're optimizing for total cost of ownership, not just unit price (Gartner, 2026), and a static spreadsheet can't track that shift. Procurement teams that can't quantify their savings struggle to justify their budget. A dashboard with savings-versus-target tracking gives you the numbers to prove ROI to the CFO, in real time, not buried in a quarterly deck.
4. Compliance and risk reduction
Maverick spend, contract leakage, and regulatory violations rarely show up in a spreadsheet until an auditor finds them. A compliance-focused dashboard flags non-compliant purchases the moment they happen, so your team fixes them before they turn expensive.
5. Faster decision-making
The old playbook, pull data, build a slide deck, present at next month's review, doesn't fit how procurement works anymore. Leaders in 2026 need to drill from summary to detail in seconds. The best purchasing decisions happen in the moment, not in a meeting room four weeks later.
6. AI-assisted exception detection
Most procurement dashboards still wait for a human to spot anomalies: an unusual price variance, a new supplier risk signal, a sudden spike in a category that's been flat for six quarters. AI-powered dashboards flip that pattern. They surface exceptions before they land in a board deck. (See "How Databrain Builds This" below for what that looks like in practice.)
11 Essential Procurement KPIs (By Category)
Most procurement teams don't need 40 metrics. You need 5 to 7 that connect directly to what your team is trying to accomplish, then expand from there. The 11 KPIs below are grouped into three categories, Spend, Supplier, and Purchase Cycle, so each procurement function can pick what matters for its own OKRs.
Cost per Purchase Order is the metric teams building their first dashboard skip most often, even though it's usually the fastest one to fix once it's visible.
Spend KPIs
1. Maverick Spend
- What it measures: Spend that occurs outside approved procurement channels, off-contract, unauthorized, or routed around the P2P system.
- Formula: (Off-contract spend ÷ Total spend) × 100
- Why it matters: Off-contract spend forfeits negotiated pricing, terms, and volume commitments. It also creates compliance exposure that surfaces during audits, not in real time.
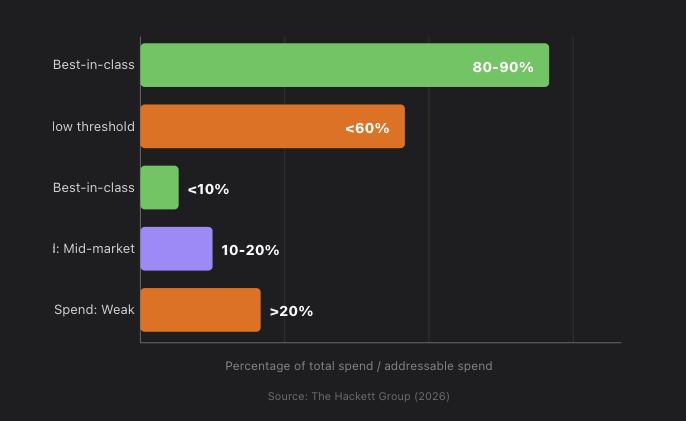
- How to interpret: Best-in-class organizations keep maverick spend under 10% (Hackett Group, 2026). 10 to 20% is common in mid-market; above 20% signals deeper procurement discipline gaps.
- Common pitfall: Counting only emergency purchases as maverick spend. Most maverick spend is routine: credit card purchases, departmental ordering, and T&E spend that bypasses the P2P system entirely.
2. Spend Under Management (SUM)
- What it measures: The percentage of total addressable spend flowing through approved procurement channels.
- Formula: (Managed spend ÷ Total addressable spend) × 100
- Why it matters: This is the first metric every CPO asks for. It tells leadership how much of the company's purchasing is actually visible and controlled, and it's a leading indicator of every other procurement KPI.
- How to interpret: Best-in-class organizations manage 80 to 90% of spend this way (Hackett Group, 2026). Below 60% signals significant maverick spend.
- Common pitfall: Inflating SUM by including spend that is technically "managed" but not strategically sourced (for example, tail spend automated through a P-card program).
Procurement Spend KPI Benchmarks by Performance Tier Spend Under Management: best-in-class organizations manage 80-90% of spend through approved channels, weak performers fall below 60%. Maverick Spend: best-in-class organizations keep unauthorized spend under 10%, mid-market typically runs 10-20%, weak performers exceed 20%. Source: The Hackett Group, 2026.
3. Purchase Price Variance (PPV)
- What it measures: The difference between standard cost and actual purchase cost for the same item.
- Formula: (Actual cost − Standard cost) × Quantity purchased
- Why it matters: A positive PPV means your team negotiated below standard cost. A negative variance means materials are getting more expensive, an early warning of inflation, supply disruption, or a weakening negotiating position.
- How to interpret: Track by category. PPV in commodities is largely market-driven; PPV in indirects is largely negotiation-driven.
- Common pitfall: Setting standard costs once a year. Standards should refresh quarterly in volatile categories.
4. Cost per Purchase Order (CPO)
- What it measures: The fully-loaded cost of creating, processing, approving, and managing a single PO.
- Formula: Total procurement operations cost ÷ Number of POs processed
- Why it matters: A CPO above $100 indicates process bloat: too many approval steps, manual data entry, or workflow tools that don't talk to each other. Industry benchmarks run $50 to $100 for digital P2P and $300+ for manual processes.
- How to interpret: Track alongside PO volume. A high CPO with low volume is a fixed-cost problem; high CPO with high volume is a process design problem.
- Common pitfall: Excluding indirect operations costs (technology, training, audit) from the calculation.
5. Procurement ROI
- What it measures: Profitability of the procurement function: savings delivered versus cost to operate.
- Formula: Total cost savings ÷ Procurement function cost
- Why it matters: Justifies the procurement team's headcount and tooling budget to the CFO. Best-in-class teams hit 5:1 or better.
- How to interpret: Below 3:1 means the function is barely paying for itself. Above 8:1 means you are likely under-investing in procurement capacity, and missing additional savings opportunities.
- Common pitfall: Counting cost avoidance as savings without distinguishing it from realized savings. Both matter; conflating them muddies the ROI signal.
Supplier KPIs
6. Supplier Quality Rating
- What it measures: A supplier's ability to deliver goods and services that consistently meet required standards.
- Formula: Composite of defect rate, on-spec delivery %, and contract compliance.
- Why it matters: Quality issues cascade. A 2% supplier defect rate doesn't just cost you the 2%; it costs you rework, customer complaints, and brand damage downstream.
- How to interpret: Tier suppliers A through D using a weighted score. A-grade gets more volume and longer contract terms; D-grade gets a corrective-action plan or replacement.
- Common pitfall: Treating quality as binary, defective or not. Severity matters: a 2% rate with critical defects is worse than a 5% rate with cosmetic ones.
7. Supplier Risk Score
- What it measures: Composite assessment of financial, operational, geopolitical, and cybersecurity risk for each supplier.
- Formula: (Financial health × 30%) + (Operational risk × 25%) + (Geopolitical risk × 25%) + (Cyber security × 20%)
- Why it matters: Proactive risk identification prevents the kind of supplier failure that takes a quarter of revenue with it. The 2020-2024 supply chain shocks taught every CPO that single-source dependencies are an unfunded liability.
- How to interpret: Aim to keep less than 20% of total spend concentrated in high-risk suppliers.
- Common pitfall: Updating risk scores annually. Financial health and geopolitical risk move quarterly, sometimes monthly.
8. Supplier Lead Time / On-Time Delivery Rate
- What it measures: The time from PO issuance to delivery, plus the percentage of deliveries arriving on or before the promised date.
- Formula: On-time deliveries ÷ Total deliveries × 100
- Why it matters: Late deliveries disrupt production schedules, delay customer orders, and force expensive expediting.
- How to interpret: 95%+ is world-class. Below 90% typically signals operational disruptions you should be acting on.
- Common pitfall: Counting "on-time" by the supplier's promised date rather than the original PO date, which lets suppliers re-promise themselves into a perfect score.
Purchase Cycle KPIs
9. Purchase Order Accuracy
- What it measures: The percentage of POs delivered with correct pricing, quantity, timeline, and quality.
- Formula: Accurate POs ÷ Total POs × 100
- Why it matters: Inaccurate POs trigger receiving disputes, invoice mismatches, and downstream finance work. Industry leaders hit 98%+.
- How to interpret: Below 95% suggests the gap is in PO data quality, not supplier performance.
- Common pitfall: Defining "accuracy" loosely. A PO that is delivered on time with the wrong SKU is still inaccurate.
10. Purchase Order Cycle Time
- What it measures: Total elapsed time from requisition submission to PO issuance (and sometimes through to delivery).
- Formula: Average days from requisition to PO approval
- Why it matters: If it takes 40 days to get from requisition to PO, the bottleneck is in the approval chain, not the supplier. This metric surfaces internal friction that's invisible without data.
- How to interpret: Industry leaders process this in under 5 days (APQC, 2026). 7 to 10 days is acceptable; over 15 days needs immediate attention.
- Common pitfall: Measuring only the headline average, missing that the p75 or p90 might be 4x the median, and that's where dissatisfaction lives.
11. Cost per Item
- What it measures: Average cost of acquiring a single product, fully loaded.
- Formula: Total purchasing expense ÷ Total quantity ordered
- Why it matters: Tracks the effectiveness of demand forecasting and consolidation. Trends matter more than absolute values.
- How to interpret: Compare to past periods and to peer benchmarks (Hackett Group and APQC publish category-specific data).
- Common pitfall: Comparing cost per item across categories with different complexity profiles. Compare apples to apples.
For a full KPI-by-KPI benchmark breakdown covering additional metrics like Spend Under Management, Procurement ROI, and Supplier Performance, see our complete procurement KPI benchmarks. For contract-specific metrics that complement these, see contract KPI benchmarks.
8 Procurement Dashboard Examples (By Audience)
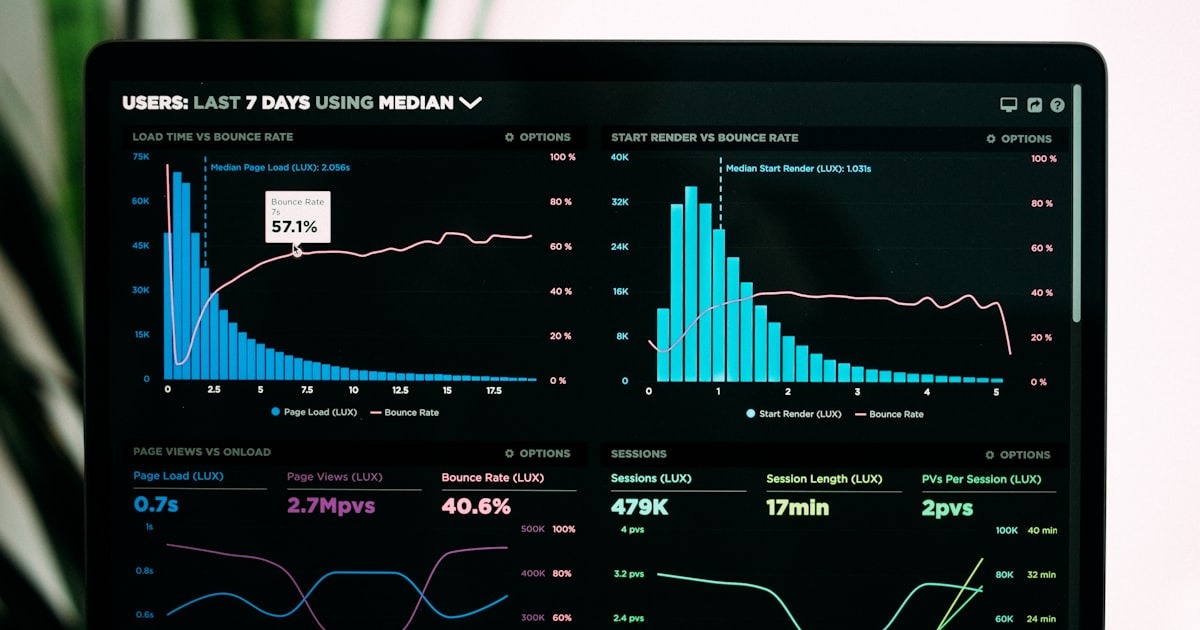
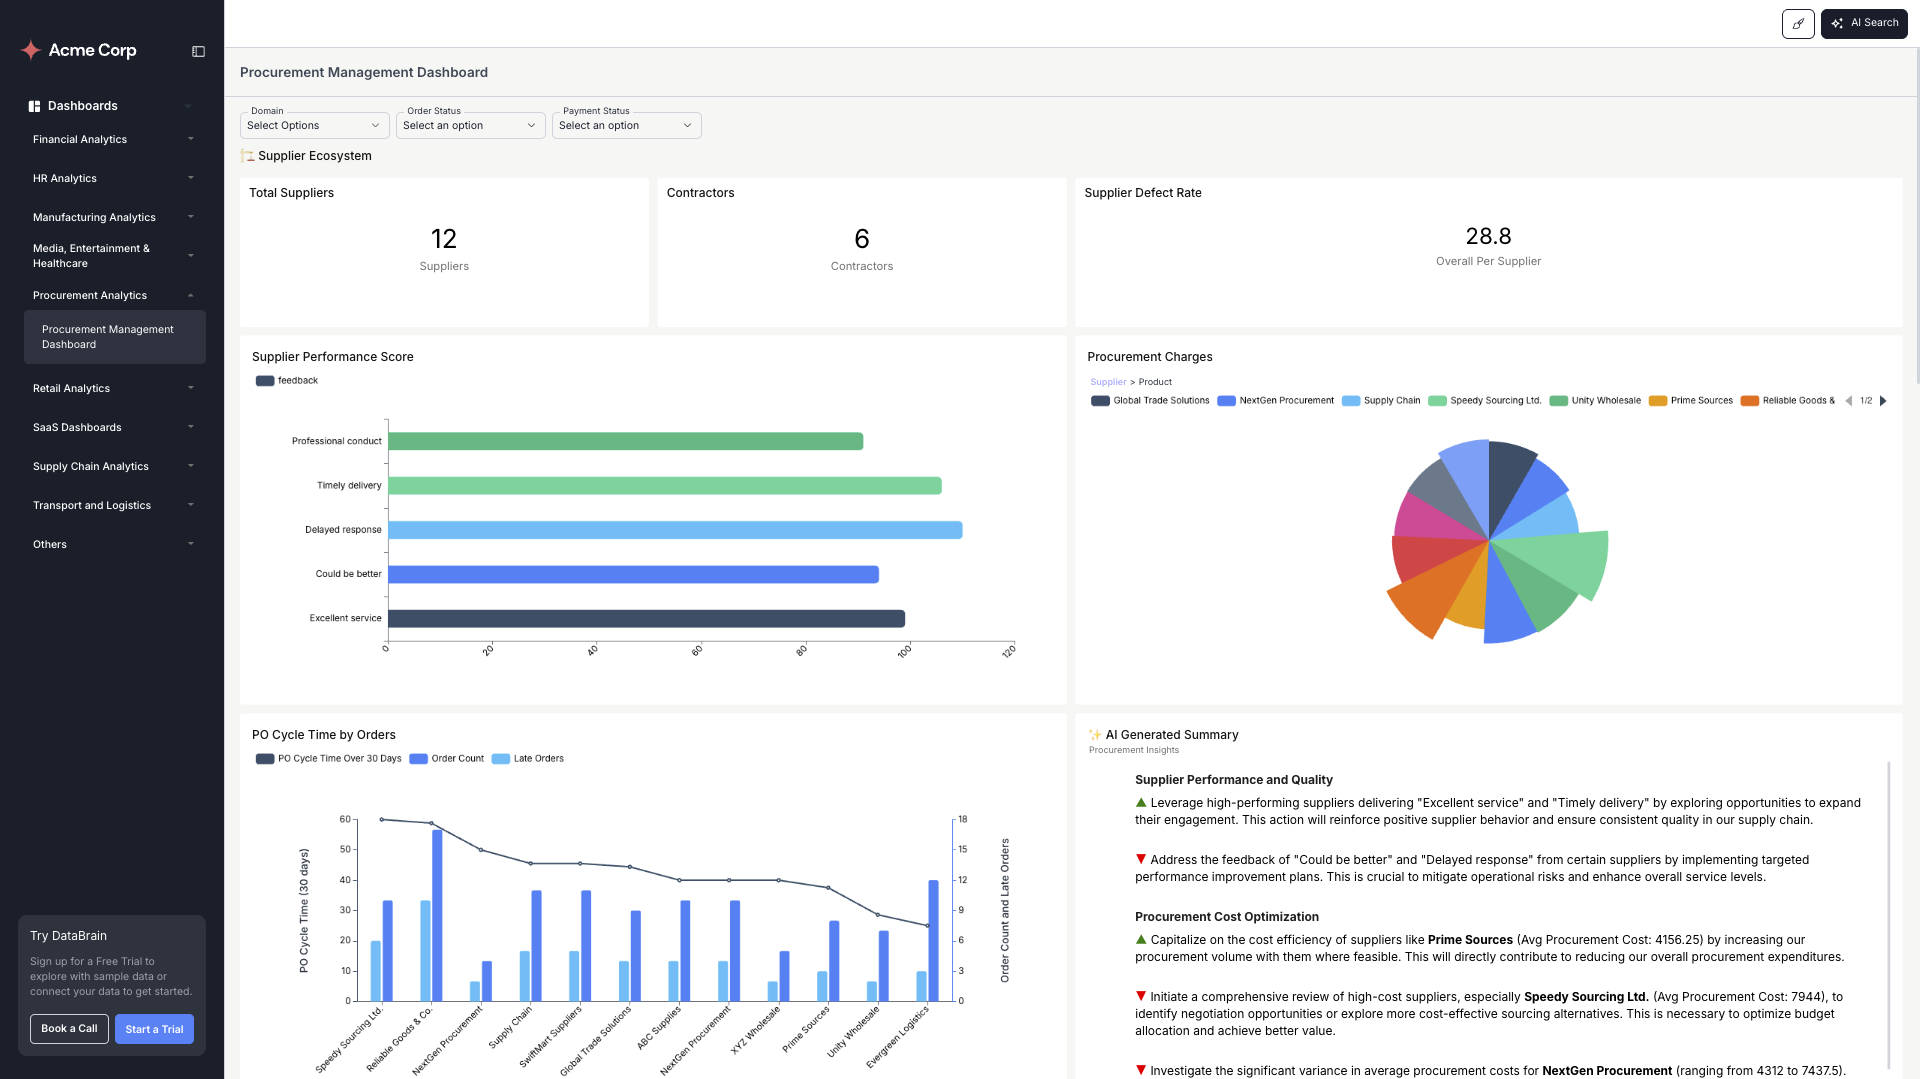
Every procurement team has different priorities, and the dashboard a CPO needs looks nothing like the one a buyer opens daily. The table below breaks down the eight dashboard types most procurement teams need, organized by audience and the decision each one drives. (See a live sample procurement dashboard for what one of these looks like in practice.)
How Do You Choose the Right Procurement Dashboard Approach?
The right way to ship a procurement dashboard depends on who's using it. Procurement teams analyzing their own company's data typically use a general-purpose BI tool: ThoughtSpot, Tableau, or Power BI. Install once, let analysts build, and the whole procurement function is served.
Procurement-tech vendors building dashboards for their own customers face a different problem entirely. Multi-tenancy, row-level security, white-label rendering, and SOC 2 evidence collection turn the project into 4 to 6 engineering months before the first customer-ready dashboard ships.
(For the deeper decision framework, including total cost of ownership, multi-tenant patterns, and when build wins versus when embed wins, see "Build vs. Embed" below.)

How to Build a Procurement Dashboard (Step-by-Step)
Step 1: Define your audience and objective
A CPO wants portfolio-level savings trends. A category manager wants supplier scorecards. A finance lead wants budget variance. These are three completely different dashboards. Start with one question: who is this for, and what decision does it help them make? One dashboard, one audience, one objective. That's the rule.
Step 2: Identify your data sources
Map every system that touches procurement data: ERP (SAP, Oracle, NetSuite), P2P platforms (Coupa, SAP Ariba, Procurify), contract lifecycle management tools, AP and invoice systems, supplier portals, and the data warehouse if you have one. The biggest thing standing between you and a useful dashboard isn't bad software. It's fragmented data.
Step 3: Select your core KPIs
Pick 5 to 7 KPIs that directly tie to what your team is measured on. You can always add more once adoption sticks. Teams that launch with more than 10 metrics on day one rarely make it past the pilot phase, because nobody has time to figure out which numbers actually matter. Use the categorization above (Spend / Supplier / Cycle) to pick a balanced set rather than five variations of the same metric.
Step 4: Choose your dashboard platform
Match the platform to your team's needs. Internal procurement teams typically use Excel for ad-hoc analysis and a general-purpose BI tool (Power BI, Tableau, ThoughtSpot) for ongoing dashboards. Procurement-tech vendors building dashboards for their customers need a different stack entirely, multi-tenant, white-label, RLS-enforced. See "Build vs. Embed" below for the framework.
Step 5: Design for action, not just display
Put the most critical KPIs above the fold. Use consistent red/yellow/green threshold coding. Enable drill-down from summary views to transaction-level detail. Add automated alerts for threshold breaches. A dashboard nobody opens is worse than no dashboard at all.
Step 6: Surface the dashboard inside the workflow
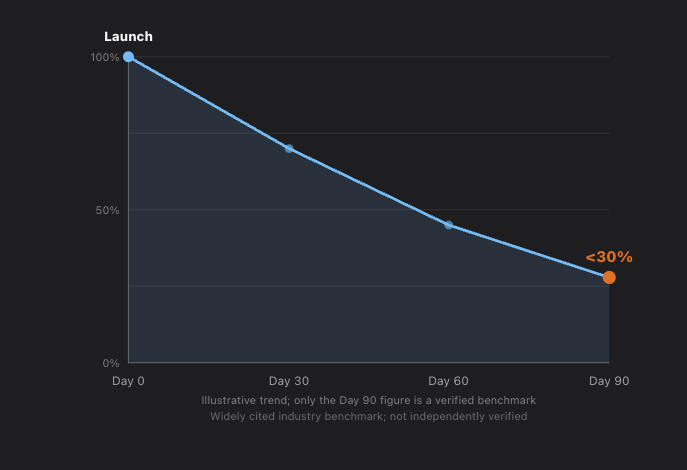
Industry-wide, fewer than 30% of deployed business dashboards are still used regularly after 90 days. The fix isn't more BI features. It's reducing the friction of opening one. The pattern holds across procurement teams generally: dashboards embedded inside the P2P platform or ERP get opened daily, while dashboards living behind a separate BI login get forgotten by week three. Whether that means a shared link in a Slack channel, an iframe inside the sourcing tool, or a dedicated analytics app, the rule is the same: meet people where they already work.
Business Dashboard Adoption Drop-Off After Launch Illustrative trend showing dashboard usage declining after launch. The Day 90 figure (fewer than 30% of deployed business dashboards still in regular use) is a widely cited industry benchmark; intermediate points show the general decline pattern, not precise measurements.
What Are the Best Practices for a Procurement Dashboard?
Practical procurement dashboards share eight habits, regardless of company size or industry. Get these right and adoption follows. Skip them and even a well-built dashboard turns into another tab nobody opens.
- One dashboard, one audience, one objective. A dashboard that tries to serve the CPO, the buyer, and the finance team simultaneously serves none of them.
- Critical KPIs above the fold. If a CPO has to scroll to find Spend Under Management, they will stop opening it.
- Drill-down from summary to detail. A big number on a screen means nothing if users can't click into the transactions behind it.
- Consistent threshold coding. Red for breached, yellow for at risk, green for on track. Readable at a glance.
- Automated alerts. Don't rely on people checking dashboards daily. Push exceptions to them instead, a Slack notification when maverick spend spikes, an email when supplier on-time rate drops below 90%.
- Mobile-responsive. Procurement leaders aren't sitting at desks all day.
- Quarterly review. The KPIs that mattered six months ago may be irrelevant today. Cut what nobody acts on.
- Add an AI-summary widget. Tools that auto-generate narrative explanations of dashboard trends raise adoption among non-analyst users. (See "How Databrain Builds This" below.)
Customer Story: Beroe Inside Coupa
Beroe, a procurement-intelligence company, uses Databrain to deliver embedded analytics inside the Coupa ecosystem. Coupa customers open Beroe's dashboards directly inside the procurement environment they already use, drill into spend, supplier, and workflow analytics, and navigate views without a separate login or context-switch. The pattern is the canonical shape for procurement-tech: workflow-native analytics that strengthen the host product instead of pulling users out of it.
Customer Story: Spendflo
Spendflo is a SaaS spend management platform for finance and procurement teams at growth-stage companies, typically $20M-$200M in revenue, with 50-200 SaaS vendors to manage and a procurement function that doesn't yet have the headcount for a dedicated analytics team. Their customers (CFOs, finance-ops leads, procurement directors) need answers about contract renewal exposure, vendor concentration, off-contract spend, and savings opportunities, typically while they're already inside the Spendflo product reviewing a contract or approving a renewal.
The analytics layer is core to the product, not an export. Spendflo's customers don't want to download a CSV and rebuild dashboards in Excel. They want the cost-per-employee trend, the vendor-concentration breakdown, and the "you're paying $300K more than peers for the same Salesforce contract" insight visible inside the renewal workflow they're already in.
Spendflo uses Databrain to deliver this embedded analytics layer. Rather than building tenant isolation, dashboard rendering, RLS enforcement, audit logging, and white-label theming from scratch, work that would have consumed 6+ engineering months and ongoing security-review burden during enterprise procurement evaluations, they integrated Databrain's embedded analytics primitives and shipped customer-facing analytics in weeks. The result: Spendflo customers reportedly see $300K+ in average annual procurement savings with the analytics surfaced exactly where they make renewal and approval decisions, not in a separate BI tool nobody opens after week three.
Read Spendflo's full case study for the complete breakdown of savings and time-to-value.
Building Procurement Analytics Into Your Product?
If you're building procurement software, supplier portals, or extending a procurement platform with analytics, embedded analytics is usually the practical path. It ships faster, carries lower engineering overhead, and the dashboards feel native to the workflow they sit inside, rather than bolted on.
How Databrain Builds This: From Fragmented Data to AI-Powered Intelligence
Procurement data typically lives in disconnected spreadsheets and siloed systems: supplier lists in one file, invoices in another, compliance checks in a third. Traditional BI dashboards can show the numbers; they rarely explain what those numbers mean or why they matter. Databrain closes that gap with three layers:
Datamart. A structured analytical layer that centralizes raw data, supplier contracts, operational logs, cost breakdowns, into one clean, consolidated foundation, so procurement teams stop chasing data across systems.
Semantic Layer. Translates technical field names into business-friendly terms stakeholders can search and query directly. totalexpense becomes Procurement Expenditure, customerrating becomes Supplier Performance Score, incidenttype becomes Procurement Delay Factor. It also defines trusted joins (supplier-to-invoice, order-to-delivery), standardizes reusable metric definitions (Total Spend, On-time Delivery Rate) for one version of the truth, and validates the model before dashboards consume it.
Chat Mode. Once the data is structured and business-ready, procurement leaders query it in plain language instead of writing SQL: "How many unique suppliers are we currently working with?" or "What is the distribution of supplier feedback categories?" The platform interprets the question, generates the underlying query, and turns the result into a reusable metric that can be dropped straight into a dashboard.
AI-powered summaries. Numbers and charts show what's happening; procurement leaders also need to know why it matters. Databrain's Metric AI Summary feature auto-generates narrative insights like "Overall procurement expenditure increased by 8% this quarter" or "Major delays are concentrated in Region Y due to logistics issues," turning a dashboard from a static report into something closer to a decision-making assistant.
Build vs. Embed: What It Actually Costs
If you're a product or engineering leader at a procurement-tech SaaS, supplier portal, or marketplace ecosystem company, customer-facing procurement analytics is a product architecture decision, not a feature decision. Three realities are driving that:
- Enterprise procurement RFPs increasingly require embedded analytics, not exports to Tableau or Power BI. Without it, you lose the deal at evaluation, not at close.
- Standalone-tool adoption falls off a cliff after 90 days. Customers stop opening separate BI tools to look at dashboards. Embedded analytics holds at 70%+ adoption because it lives where the procurement workflow already happens.
- Building in-house competes with your core procurement workflow roadmap for engineering capacity. Most procurement-tech teams who try to build analytics in-house end up rewriting it within 18 months as multi-tenant requirements evolve.
The build path: 12-18 months to production-ready. 3-4 dedicated engineers permanently (2 backend, 1-2 frontend, 1 devops). Hidden costs: SOC 2 audit, GDPR compliance, browser compatibility, accessibility, internationalization. Total 3-year cost at 50-customer scale: $2M-$3M loaded engineering.
The embed path: Days to weeks for first production dashboard. 0-1 partial FTE for integration; vendor handles infrastructure. Hidden costs inherited (vendor handles SOC 2, GDPR, etc.). Total 3-year cost at 50-customer scale: $50K-$150K licensing.
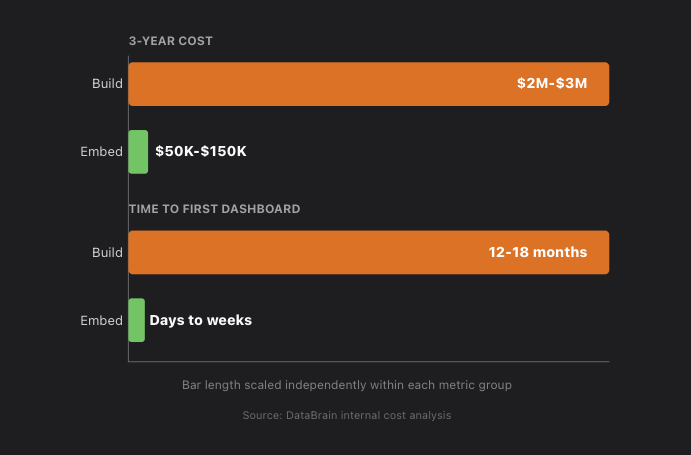
3-Year Total Cost of Ownership at 50-Customer Scale: Build vs. Embed Building embedded analytics in-house costs $2M-$3M in loaded engineering over 12-18 months to first production dashboard. Embedding with a vendor platform costs $50K-$150K in licensing, shipping the first production dashboard in days to weeks. Source: internal DataBrain cost analysis, as presented in this post's Build vs. Embed section.
Embedded Analytics Platforms Compared
For procurement-tech vendors shipping analytics to their own customers (a fundamentally different decision than an internal team buying a BI tool for its own use), the credible embedded analytics platforms in 2026:
→ Ready to evaluate a platform built for this? See Databrain's embedded procurement analytics platform, including the pattern Beroe uses inside the Coupa ecosystem.
→ Want the technical architecture first? Read Building Embedded Procurement Dashboards: Architecture Guide for multi-tenant patterns, white-label SDK integration, production-ready SQL for every KPI above, and a month-by-month build sequence.
→ Want to model the cost for your situation? Use the Embedded Analytics Cost Calculator.
Sources
This guide draws on the following authoritative procurement and procurement-analytics research:
- Gartner, Sourcing and Procurement Costs. Source for the "72% of sourcing and procurement leaders aim to deliver value by optimizing total cost of ownership" benchmark.
- Gartner, "Gartner Predicts 70% of Technology Sourcing Leaders Will Have Environmental-Sustainability-Aligned Performance Objectives by 2026" (press release, Jan 2023). Source for the ESG dashboard section's 70% figure.
- Deloitte, 2025 Global Chief Procurement Officer Survey. Source for the "Digital Masters" technology-investment statistic.
- The Hackett Group, Sourcing & Procurement Benchmarking. Cross-industry procurement benchmarks, including Spend Under Management and Maverick Spend thresholds.
- APQC, Cycle Time to Issue a Purchase Order in Days. Source for PO Cycle Time benchmarks.
- NetSuite, "35 Procurement KPIs to Know & Measure." Reference for the broader procurement KPI landscape.
- Sievo, "Procurement KPIs: a complete list." Reference for supplier-performance scorecard methodology.
- Procurify, "Purchasing problems and solutions." General reference on P2P and procurement software patterns.
For category-specific procurement metrics that complement these, explore our renewal and compliance tracking guide, our transportation analytics strategy guide, and our supply chain analytics guide.
About the author
Vishnupriya B is a Data Analyst at Databrain specializing in data visualization, SQL, Python, and data modeling. She works on procurement, contract, and supply-chain analytics implementations across the Databrain customer base and writes about the patterns that separate dashboards people actually use from ones that get abandoned in 90 days. Connect on the author page.
Frequently Asked Questions
What is a procurement dashboard?
A procurement dashboard is a live visual layer on top of your purchasing data - spend, supplier performance, contract compliance, cost savings, PO cycle times - consolidated into one screen with charts and KPI cards. It replaces spreadsheet-based reporting with interactive views that update in real time.
What KPIs should a procurement dashboard include?
Most procurement teams don't need 40 metrics; 5 to 7 tied to current OKRs is enough to start. This guide covers 11 across three categories: Spend (Maverick Spend, Spend Under Management, Purchase Price Variance, Cost per PO, Procurement ROI), Supplier (Quality Rating, Risk Score, On-Time Delivery), and Purchase Cycle (PO Accuracy, PO Cycle Time, Cost per Item).
How do I build a procurement dashboard in 2026?
Define audience and objective, identify data sources (ERP, P2P, contracts), select 5–7 KPIs, choose a platform, design for action with drill-downs and alerts, and embed it in the workflow team members already use. Most failed dashboards skip the last step.
What is the difference between a procurement dashboard and procurement analytics?
A procurement dashboard is the visualization layer that displays metrics and trends. Procurement analytics is the broader discipline of analyzing procurement data to find patterns, predict outcomes, and recommend actions. The dashboard is one output of a procurement analytics program.
Can I build a procurement dashboard in Excel?
Yes - for one-off analysis. Excel handles small datasets with pivot tables and charts. But Excel cannot do real-time refresh, multi-user access, or drill-down to transaction detail. For anything beyond ad-hoc work, dedicated dashboard tools or embedded analytics are more effective.


