
.png)
When your roadmap includes a feature customers stare at every day ,say an interactive dashboard in-app, a KPI email in their inbox, or a push alert on their phone, the "move fast and break things" method kills trust. Yet a year-long waterfall plan is equally detrimental; by the time you launch, the questions customers care about will have moved on.
Agile works best when you treat analytics as a product surface, not a report, which is why the core patterns of embedded analytics matter early in the roadmap.
Agile offers a sane middle path: ship thin slices, learn quickly, and steer with evidence. Below you'll find an expanded playbook—complete with intros, deep dives, technical tips, and real-world proof—showing how SaaS product teams can use Scrum, Kanban, and SAFe to design, build, and scale their customer-facing analytics.
Why Customer-Facing Analytics Loves Agile
Building analytics for customers is different from building an internal report. Metrics change, data pipelines fail, and user expectations shift overnight. Agile's short feedback loops and cross-functional rituals make that volatility an asset instead of a nightmare.
Teams that combine agile ceremonies with automated BI testing report higher adoption and trust in their analytics outputs.
Choosing Your Framework
No single agile framework fits every analytics situation. The best choice depends on whether you need predictability, flow, or large-scale coordination.
Atlassian's own agile guide sums it up well: "Kanban is great for teams with lots of incoming requests that vary in priority and size, whereas Scrum needs tight control over scope." (atlassian.com)
Match the pain you're feeling—focus (Scrum), flow (Kanban), or cross-team alignment (SAFe)—rather than chasing trendiness.
Scrum Deep-Dive – Launching New Dashboards
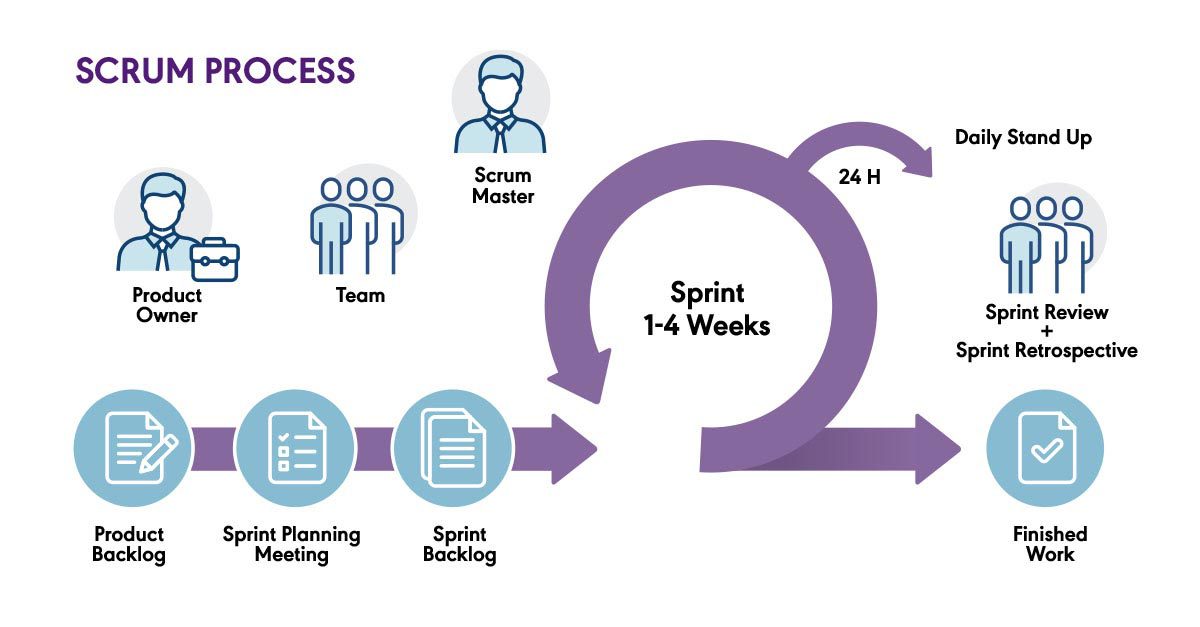
Scrum shines when you can carve a brand-new analytics feature into small, demo-ready slices and want a predictable cadence.
A dedicated Scrum pod at a healthcare-data firm shipped a full self-service portal in exactly six months by demo-ing every two weeks and slicing work end-to-end—surprising even the client. (launchconsulting.com)
Scrum's time-boxing forces the team to keep the increment small but whole: data in, chart out, feedback back. That rhythm builds stakeholder confidence and exposes metric misunderstandings early—before schema changes become re-writes.
Kanban Deep-Dive – Evolving Live Analytics
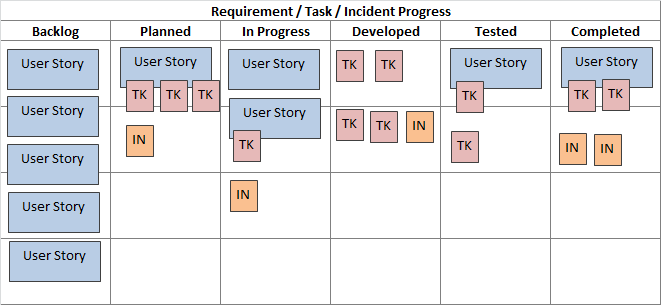
Once a dashboard is live, feature requests, bug fixes, and "one more KPI" demands arrive nonstop. Kanban embraces that reality with pull-based flow and WIP limits.
- Visual board—Backlog → Dev → Data QA → Review → Done.
- Hard WIP limits—two cards per engineer; swarm when a column is full.
- SLE target: median cycle time < 7 days; inspect cumulative-flow weekly.
- Classes of Service: expedite lane for production-blocking data issues.
Devtron's first DevOps-metrics dashboard flopped; almost no one used it. By switching to Kanban, reframing items as "Questions to be Answered," and flowing tiny redesigns, engagement shot up. (devtron.ai)
Kanban's superpower is visibility: you can't hide a stalled card. Combined with cycle-time tracking, that transparency nudges teams to automate slow steps—particularly data validation—so small enhancements reach users in days, not sprints.
SAFe Deep-Dive – Coordinating Multiple Analytics Teams
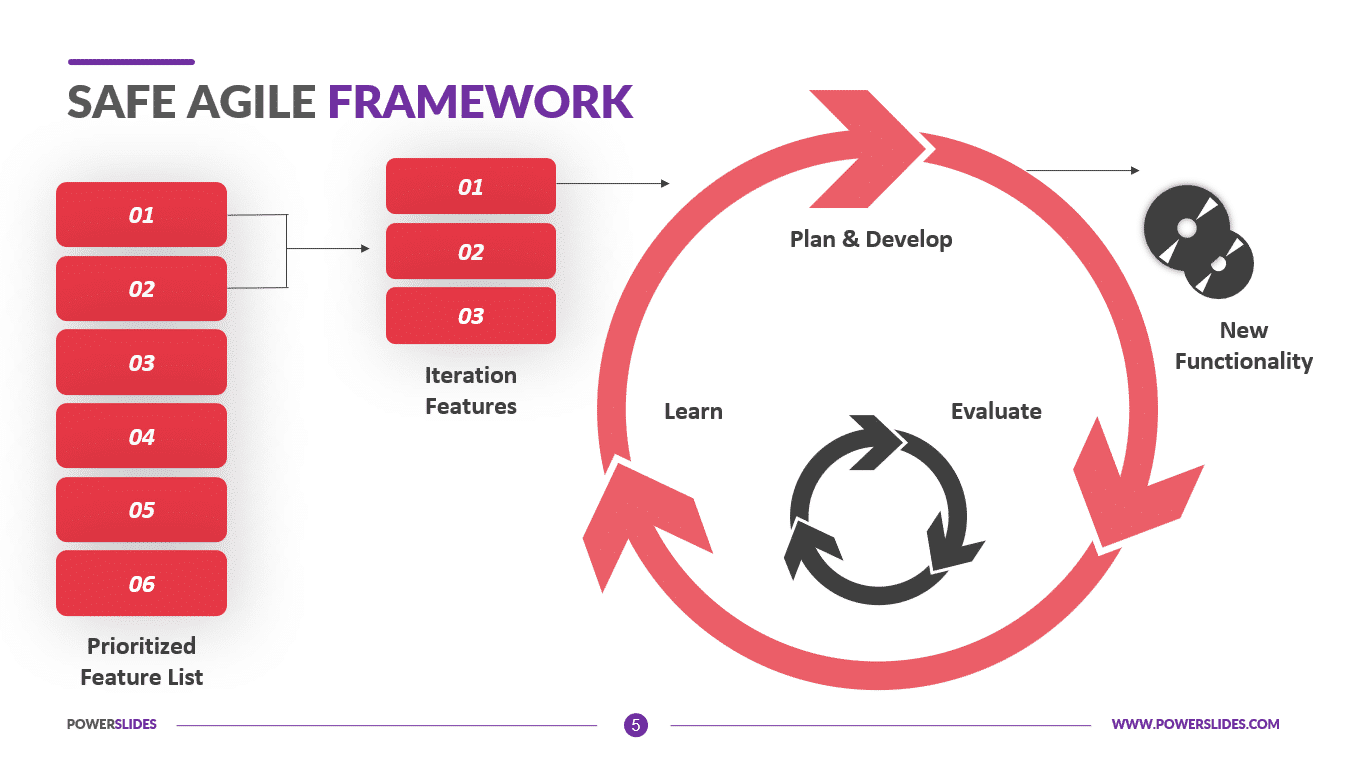
When your analytics vision spans several squads—data ingestion, semantic modeling, front-end, mobile, AI insights—Scrum-of-Scrums may not cut it. SAFe provides the governance layer without crushing agility.
FEMA's EDAMI program adopted SAFe to modernize disaster-response analytics, forming ARTs, setting PI planning every 10-12 weeks, and rolling out a unified CI/CD pipeline—dramatically accelerating feature delivery and cross-team collaboration. (wilcogroupllc.com)
SAFe works when the pain is coordination: it gives leadership a big-room planning forum while still letting individual teams run Scrum. The cost—more meetings—is worth it only once dependencies among analytics squads start delaying production releases.
Process Playbook That Works in Any Framework
Frameworks differ, but certain hygiene habits keep analytics projects healthy no matter what cadence you run.
- Backlog hygiene—tag stories "Data Prep," "UI," "Perf" to balance scope.
- Spikes—time-box research on new algorithms or metrics.
- Expanded DoD—data validated, dashboard loads < 2 s with 100 k rows, edge-case UX handled.
- Demo early, demo ugly—wireframes with mock data prevent months of waste.
Data-centric retros—convert recurring ETL failures into backlog items.
These micro-practices prevent the classic failure mode—gorgeous UI on shaky data—and create a culture where every increment is usable, not just "dev-complete."
Technical Backbone – CI/CD & Data QA
Rapid iterations demand automation. Without CI/CD and data-quality gates your "agile" project just ships bugs faster.
Organizations adopting CI/CD plus analytics QA raise user trust, boost adoption, and shorten release cycles.
Treat dashboards as code: store JSON configs in Git, run automated tests on every PR, and deploy behind feature flags. Done right, a metric tweak merges at 10 a.m. and is live for customers before lunch—with zero drama.
Real-World Examples
Here are well-documented wins—from big enterprises to startups—that lean on agile for customer-facing analytics.
The common thread isn't the brand of agile—it's disciplined iteration, ruthless transparency, and automated quality gates that let data teams move at the speed of product teams.
Deciding & Evolving
Frameworks aren't life sentences; they're stages of growth.
Start with Scrum for a green-field dashboard, layer in Kanban when enhancement requests flood in, and graduate to SAFe once multiple squads own a single analytics vision. Many Databrain teams mix: Scrum sprints for net-new work, Kanban lanes for urgent fixes, all visualized on one board.
Follow a simple rule: add ceremony only when coordination pain costs more than the overhead.
Key Takeaways (TLDR;)
If you remember nothing else, keep these five principles on your team wall.
Agile isn't magic, but wielded well it turns analytics from a giant spec doc into a living feature your customers love—and trust.
Conclusion — Build vs. Buy (and Why Databrain Tips the Scale)
Intro. Every agile practice in this guide still leaves you with a strategic fork in the road: build analytics in-house or embed a specialist product such as Databrain. Both paths can work, but their risk, speed, and long-term economics look very different once you run the numbers.
Why Databrain edges ahead. If analytics is not your product's primary value prop, embedding a purpose-built platform shortens sprints, slashes QA overhead, and lets cross-functional teams devote their agile cycles to features that actually differentiate your SaaS.
Research from multiple cost-of-ownership analyses shows that turnkey embedded dashboard solutions outstrip home-grown builds on both speed and total cost once the second year of maintenance hits. And because Databrain's roadmap evolves in lock-step with modern data-stack trends (from vector search to AI-generated insights), you inherit continuous innovation without burning your own backlog.
Final Word. Agile frameworks can certainly help you build analytics faster, but they can't erase the hidden costs of owning that stack forever. For many SaaS teams the most agile move is, paradoxically, to buy—embedding Databrain, then using Scrum or Kanban to integrate and extend it. You still iterate, you still demo, you still learn from users—only you start several months and millions of engineering calories ahead.


