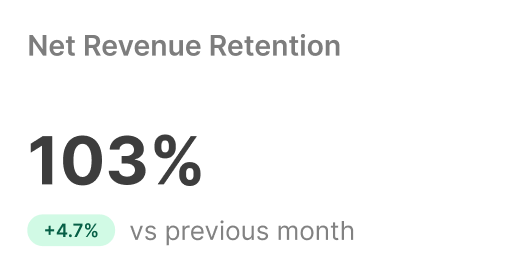
Net Revenue Retention (NRR)- NRR goes beyond simply holding on to customers
It measures how well you turn satisfied users into loyal advocates who spend more over time. A healthy NRR above 100% signals that your existing customers aren’t just sticking around; they’re deepening their commitment and expanding their investment in your product.
Source Table
Columns used
main.saas_data_customers
signup_date, customer_id
main.saas_data_subscriptions
customer_id, plan_id, start_date, end_date
main.saas_data_plans
plan_id, monthly_price
main.saas_data_events
customer_id, event_id, is_churn, event_date
WITH
"cohort_signups" AS (
  SELECT
    DATE_TRUNC('month', "customers"."signup_date") AS "cohort_month",
    "customers"."customer_id"
  FROM "main"."saas_data_customers" AS "customers"
),

"cohort_revenue" AS (
  SELECT
    "cohort_signups"."cohort_month",
    ROUND(SUM("plans"."monthly_price")::DOUBLE, 2) AS "retained_revenue"
  FROM "main"."saas_data_subscriptions" AS "subscriptions"
  JOIN "main"."saas_data_plans" AS "plans"
    ON "subscriptions"."plan_id" = "plans"."plan_id"
  JOIN "cohort_signups"
    ON "subscriptions"."customer_id" = "cohort_signups"."customer_id"
  LEFT JOIN "main"."saas_data_events" AS "events"
    ON "subscriptions"."customer_id" = "events"."customer_id"
    AND "events"."is_churn"
    AND "events"."event_date" BETWEEN "subscriptions"."start_date" AND COALESCE("subscriptions"."end_date", CURRENT_DATE)
  WHERE "events"."event_id" IS NULL
  GROUP BY "cohort_signups"."cohort_month"
),

"cohort_churn" AS (
  SELECT
    "cohort_signups"."cohort_month",
    ROUND(SUM("plans"."monthly_price")::DOUBLE, 2) AS "churned_revenue"
  FROM "main"."saas_data_subscriptions" AS "subscriptions"
  JOIN "main"."saas_data_plans" AS "plans"
    ON "subscriptions"."plan_id" = "plans"."plan_id"
  JOIN "cohort_signups"
    ON "subscriptions"."customer_id" = "cohort_signups"."customer_id"
  JOIN "main"."saas_data_events" AS "events"
    ON "subscriptions"."customer_id" = "events"."customer_id"
    AND "events"."is_churn"
    AND "events"."event_date" BETWEEN "subscriptions"."start_date" AND COALESCE("subscriptions"."end_date", CURRENT_DATE)
  GROUP BY "cohort_signups"."cohort_month"
)

SELECT
  "cohort_revenue"."cohort_month" AS "cohort_month",
  ROUND(
    100 *
    (COALESCE("cohort_revenue"."retained_revenue", 0) - COALESCE("cohort_churn"."churned_revenue", 0))
    / NULLIF(COALESCE("cohort_revenue"."retained_revenue", 0), 0),
    2
  ) AS "nrr"
FROM "cohort_revenue"
LEFT JOIN "cohort_churn"
  ON "cohort_revenue"."cohort_month" = "cohort_churn"."cohort_month"
ORDER BY "cohort_revenue"."cohort_month"
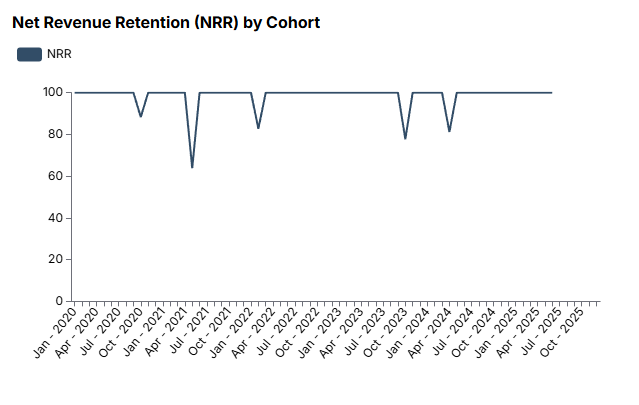
Visualization Ideas:
Line Chart: Track churn over time to spot trends before they become problems.
Implementation Checklist
Define your metrics and add them to a data dictionary.
Ensure your database schema supports the required calculations.
Write and test SQL queries for each metric.
Import results into your BI tool. Get started with DataBrain today!
Build and share dashboards with stakeholders.
Schedule regular reviews and updates.
Unlock the power of your data. Start using this SQL Playbook today!
“In the world of SaaS, data is everyone’s responsibility. With this playbook, anyone can own their metrics and drive better outcomes.”
Now, simply run the SQL queries on your data and unlock the power of your SaaS analytics!
Net Revenue Retention (NRR)- NRR goes beyond simply holding on to customers
It measures how well you turn satisfied users into loyal advocates who spend more over time. A healthy NRR above 100% signals that your existing customers aren’t just sticking around; they’re deepening their commitment and expanding their investment in your product.
Source Table
Columns used
main.saas_data_customers
signup_date, customer_id
main.saas_data_subscriptions
customer_id, plan_id, start_date, end_date
main.saas_data_plans
plan_id, monthly_price
main.saas_data_events
customer_id, event_id, is_churn, event_date
WITH
"cohort_signups" AS (
  SELECT
    DATE_TRUNC('month', "customers"."signup_date") AS "cohort_month",
    "customers"."customer_id"
  FROM "main"."saas_data_customers" AS "customers"
),

"cohort_revenue" AS (
  SELECT
    "cohort_signups"."cohort_month",
    ROUND(SUM("plans"."monthly_price")::DOUBLE, 2) AS "retained_revenue"
  FROM "main"."saas_data_subscriptions" AS "subscriptions"
  JOIN "main"."saas_data_plans" AS "plans"
    ON "subscriptions"."plan_id" = "plans"."plan_id"
  JOIN "cohort_signups"
    ON "subscriptions"."customer_id" = "cohort_signups"."customer_id"
  LEFT JOIN "main"."saas_data_events" AS "events"
    ON "subscriptions"."customer_id" = "events"."customer_id"
    AND "events"."is_churn"
    AND "events"."event_date" BETWEEN "subscriptions"."start_date" AND COALESCE("subscriptions"."end_date", CURRENT_DATE)
  WHERE "events"."event_id" IS NULL
  GROUP BY "cohort_signups"."cohort_month"
),

"cohort_churn" AS (
  SELECT
    "cohort_signups"."cohort_month",
    ROUND(SUM("plans"."monthly_price")::DOUBLE, 2) AS "churned_revenue"
  FROM "main"."saas_data_subscriptions" AS "subscriptions"
  JOIN "main"."saas_data_plans" AS "plans"
    ON "subscriptions"."plan_id" = "plans"."plan_id"
  JOIN "cohort_signups"
    ON "subscriptions"."customer_id" = "cohort_signups"."customer_id"
  JOIN "main"."saas_data_events" AS "events"
    ON "subscriptions"."customer_id" = "events"."customer_id"
    AND "events"."is_churn"
    AND "events"."event_date" BETWEEN "subscriptions"."start_date" AND COALESCE("subscriptions"."end_date", CURRENT_DATE)
  GROUP BY "cohort_signups"."cohort_month"
)

SELECT
  "cohort_revenue"."cohort_month" AS "cohort_month",
  ROUND(
    100 *
    (COALESCE("cohort_revenue"."retained_revenue", 0) - COALESCE("cohort_churn"."churned_revenue", 0))
    / NULLIF(COALESCE("cohort_revenue"."retained_revenue", 0), 0),
    2
  ) AS "nrr"
FROM "cohort_revenue"
LEFT JOIN "cohort_churn"
  ON "cohort_revenue"."cohort_month" = "cohort_churn"."cohort_month"
ORDER BY "cohort_revenue"."cohort_month"
Visualization Ideas:
Line Chart: Track churn over time to spot trends before they become problems.
Implementation Checklist
Define your metrics and add them to a data dictionary.
Ensure your database schema supports the required calculations.
Write and test SQL queries for each metric.
Import results into your BI tool. Get started with DataBrain today!
Build and share dashboards with stakeholders.
Schedule regular reviews and updates.
Unlock the power of your data. Start using this SQL Playbook today!
“In the world of SaaS, data is everyone’s responsibility. With this playbook, anyone can own their metrics and drive better outcomes.”
Now, simply run the SQL queries on your data and unlock the power of your SaaS analytics!
Make analytics your competitive advantage
Get it touch with us and see how Databrain can take your customer-facing analytics to the next level.