.png)
.png)
Introducing User Defined Fields: Handle Any Client Data Model Without Schema Changes
Every new client brings their own data model with their own field names, structures, and definitions.
An academy tracks learner progress. A company measures employee performance. Both deal with “people data,” yet what they track, how they name it, and what they care about are entirely different.
In the past, this often meant building and maintaining separate curated dashboards for each client, which made scaling analytics harder.
With DataBrain, that’s no longer the case. Instead of just supporting User Defined Fields (UDFs), we’ve made UDF handling universal. Now, with minimal setup, a single dashboard can flex to each client’s unique schema. You simply map their fields once through our UI or API, and DataBrain applies that configuration across clients, delivering a consistent, elegant analytics experience that still feels personalized for every organization.
The Challenge: Every Client Speaks a Different Data Language
When you connect DataBrain to multiple clients, each operates its own database, often with its own flavor of "user data."
Across all of them, certain fields are common (like User ID, Name, Location). Others are completely unique to each business.
The real challenge?
We needed a way to keep common fields consistent across all dashboards while allowing each client to define and use their own custom fields, without making any schema changes or adding engineering overhead.
That's where DataBrain's Custom Field Framework comes in.
Our Approach: Common + Custom Fields, Unified
We designed DataBrain's architecture to treat every client's database as a mix of two layers:
- Common Fields – The baseline attributes that exist in every client's data (like User ID, Name, Location, DOB, Age)
- Custom Fields – Client-specific fields that capture what makes their business unique (like Course, Salary, Manager, Completion Status)
This model ensures that dashboards, filters, and metrics remain consistent across clients even when the data behind them differs completely.
How We Built It: Readable, Scalable, Flexible
Each tenant (client) database connects to a few lightweight, human-readable tables:
- Field_Definitions – Lists all available fields and their metadata
- Field_Values – Stores the actual values for those fields, linked by user
- Academy_User_Data or Company_Employee_Data – The final, flattened views that combine all relevant attributes for that tenant
By standardizing how data is defined and stored, DataBrain enables teams to configure and manage both common and custom fields dynamically, without any schema-level edits.
Real Example: Academy Setup
In an academy environment, DataBrain reads from the connected DataMart and surfaces the available fields in the UI.
From there, analysts can easily mark which ones are common and which are custom:
- Common fields: User ID, Name, Location, DOB, Age
- Custom fields: Course, Category, Completion Status, Score, Professor
This lets the academy analyze student demographics using the common fields, while also unlocking advanced insights like:
- Course completion trends by category
- Average scores by professor
- Regional performance comparisons
All of this happens without altering the underlying database structure.
Real Example: Company Setup
For a corporate client, the same framework applies.
- Common fields: User ID, Name, Location, DOB, Age
- Custom fields: Department, Job Title, Salary, Hire Date, Manager
With this setup, your client can track:
- Headcount by department or manager
- Salary distribution across locations
- Hiring trends over time
All through the same dashboard interface powered by DataBrain, with just one field configuration process.
Behind the Scenes: How the Magic Happens
When a client connects their database, DataBrain provides a simple UI for engineers or analysts to define which fields should be treated as common and which as custom.
Through an intuitive toggle, users can mark the standard fields that stay consistent across clients, while the rest are categorized as custom for that tenant.
If each client has its own dedicated database or schema, you don’t have to repeat the setup for every one of them. Once the common fields are defined for one database or schema, DataBrain can infer and reuse that configuration for others with a similar structure, saving significant setup time.
Both common and custom fields then become instantly available for analytics, ready to be used in charts, tables, and filters, without the need for schema changes or dashboard rebuilds.
This approach gives BI teams full control and flexibility, ensuring that dashboards remain consistent across clients while still adapting to each client’s unique data model.
Visualizing the Impact
One of the most powerful aspects of our architecture is how custom fields seamlessly extend into the visualization layer, not just as data columns, but as interactive filters and dynamic chart axes.
When DataBrain classifies fields as common or custom through the setup process, those fields immediately become available in two key areas of the dashboard.
Drop-Down Filters
Every custom field can be exposed as a filterable dimension, giving users fine-grained control over the data they view.
Academy Setup: Users can filter reports by Course, Category, or Professor, instantly narrowing down insights to a specific subject or instructor.
Example: "Show me learners in the Data Science course taught by Professor Ananya."

Company Setup: Users can apply filters like Department, Manager, or Job Title to focus on particular teams or hierarchies.
Example: "Show me employees in the Sales department under Manager Helen."

These filters adapt per tenant, ensuring that even client-specific data points are easily accessible and intuitive for end users.
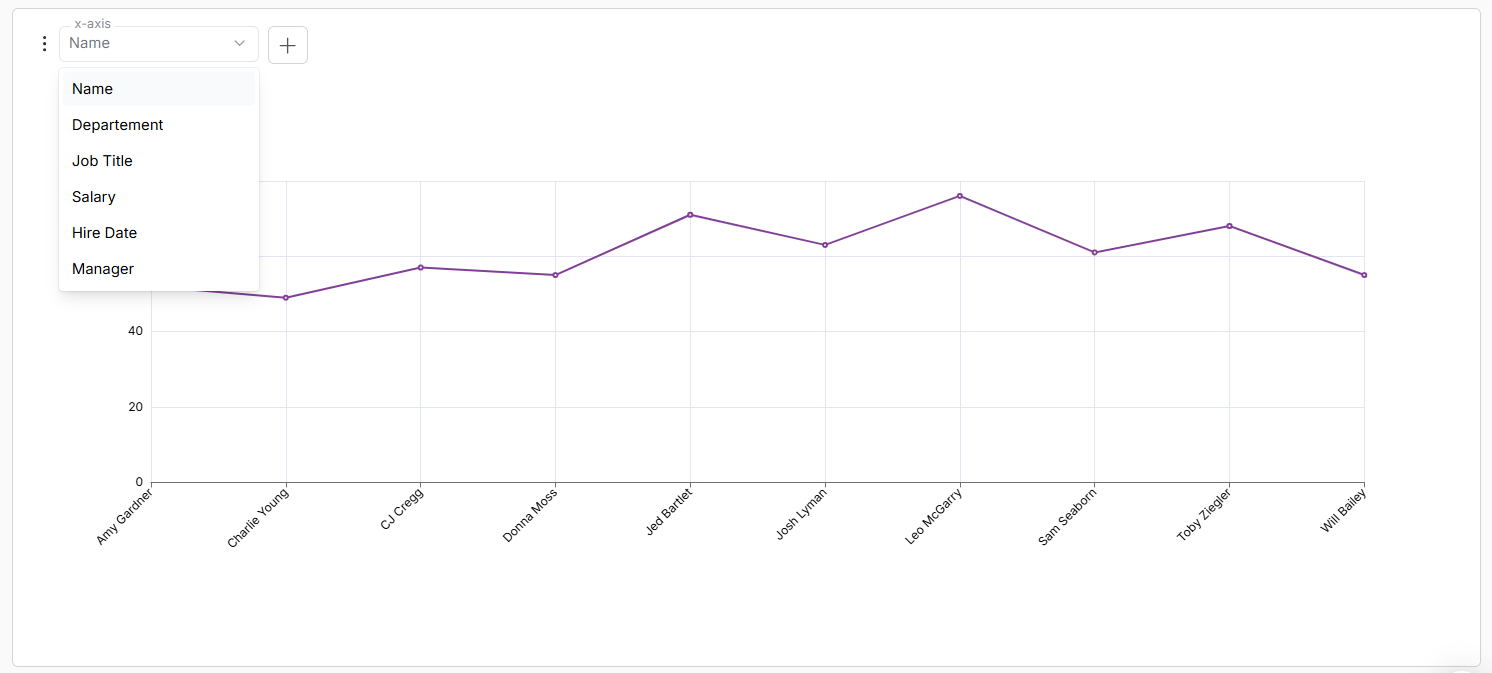
Switchable X-Axis in Charts
Custom fields also appear as toggleable options for the X-axis in DataBrain’s chart builder.
This gives users the freedom to switch chart perspectives on the fly, moving from a high-level overview to a more specific breakdown with a single click.
Academy Example: Start with a chart showing Average Score by Location (common field), then toggle the X-axis to Average Score by Course or by Professor (custom fields).

Company Example: Begin with Headcount by Location (common), then switch to Headcount by Department or Salary Distribution by Manager (custom).
This flexibility empowers every client to explore their data through their own business lens, all within a consistent and unified visualization experience.
The Outcome: Flexibility Without Fragmentation
With this unified approach, DataBrain empowers every organization to tell its own data story while maintaining structural harmony across the platform.
- For your clients: Complete control over what data matters to them
- For you: Every tenant can scale independently without breaking shared logic
- For BI users: Dashboards that evolve as fast as their business does
Key Takeaways
DataBrain's Custom Field Framework bridges the gap between standardization and customization.
It’s how we deliver a platform that’s consistent for internal analytics yet flexible enough for every client’s unique needs.
Because at the end of the day, every organization’s data looks different, but with DataBrain, the experience never does.
Frequently Asked Questions
How do I set up User Defined Fields for a new client?
Every time a new client is added (technically a database or schema), you just need to sync your connection. Once connected, the DataMart will infer base fields. You then define any custom fields through the DataBrain UI.
Do I have to set up common fields for each client individually?
No. You only need to configure the common fields once for one database or schema. DataBrain then applies the same configuration to other client databases automatically, saving time and ensuring consistency.
Can I update field definitions through the UI after the initial setup?
Absolutely. The DataBrain UI includes a field management panel where you can add, edit, or remove custom fields at any time. These changes reflect immediately in dashboards and queries.
What if a client adds new fields to their database after the initial setup?
You can manually add these new fields through the UI. There’s no automatic scanning, which means you retain complete control over what gets exposed. Just define the new field, and it becomes available across all relevant dashboards.
Can users create visuals or charts using custom fields?
Yes. Custom fields are fully integrated into DataBrain’s visualization layer. They can be used as filters, dimensions, or metrics in charts and tables, just like any native database field.


