Fintech Dashboard: 6 Examples by Segment, Chart Design & KPIs (2026)
What a fintech dashboard actually is in 2026, the 6 archetypes that cover ~95% of use cases - payments, lending, neobank/account, wealth-tech, CFO-stack/reconciliation, compliance/risk officer - with the KPIs, data sources, and refresh cadence each one needs.

.png)
Key Takeaways
- Six archetypes cover most fintech dashboard needs: payments, lending, neobank/account, wealth-tech, CFO-stack/reconciliation, and compliance/risk. Each has a different persona, KPI set, and data-freshness SLA.
- Payments dashboards carry the tightest latency requirement (sub-minute), driven by instant rails (FedNow, RTP, UPI) whose volumes keep climbing (BIS CPMI Brief No. 12, 2026).
- Seven chart types cover about 90% of the work.
- Red/green-only color coding fails for roughly 1 in 12 men (Colour Blind Awareness); pair color with shape or labels.
- In our experience, an in-house dashboard layer costs 6 to 12 engineering months; embedding cuts that to weeks.
A fintech dashboard is the customer-facing analytics surface inside a fintech product: the screen a merchant, lender, account holder, advisor, or CFO logs into to see the numbers your product produces for them. This guide covers the 6 dashboard archetypes that handle roughly 95% of fintech use cases, the KPIs and data sources each one needs, and how to design the charts inside them.
One disambiguation before we start. If you're looking for product-usage analytics for your own growth team (funnels, feature adoption, retention curves), that's a product analytics tool, and a different category entirely. This guide is about the fintech data dashboards you ship to your customers.
The Dashboard Layer Decides Fintech Retention
Fintech funding keeps concentrating in segments where analytics is part of the product itself. Per CB Insights, State of Fintech Q1 2026, payments infrastructure, lending tech, CFO-stack, and wealth-tech platforms absorb a disproportionate share of investment. In our work with fintech SaaS teams, the vendors winning those segments ship in-product analytics as a core feature. The ones losing renewals ship a CSV export and call it reporting.
This guide walks through the 6 fintech dashboard archetypes, the KPIs each one surfaces, the data sources each one integrates, and the refresh cadence each one needs. Then it covers how to visualize the data inside each: the chart types, color coding, and real-time layering decisions that hold up under a fintech product's precision requirements.
For the strategy layer these dashboards roll up to, see fintech data analytics. For the metrics themselves, see fintech KPIs and metrics. And this guide has a sister page: financial dashboards covers dashboards finance teams use; this one covers dashboards fintech products ship.
What Makes a Fintech Dashboard Different From a Generic BI Dashboard?
Three constraints separate a fintech dashboard from a generic business intelligence dashboard, and ignoring any of them is how teams end up rebuilding the layer within 12-18 months. If you've evaluated a business intelligence dashboard for fintech use and wondered why the generic tools keep falling short, it's almost always one of these three.
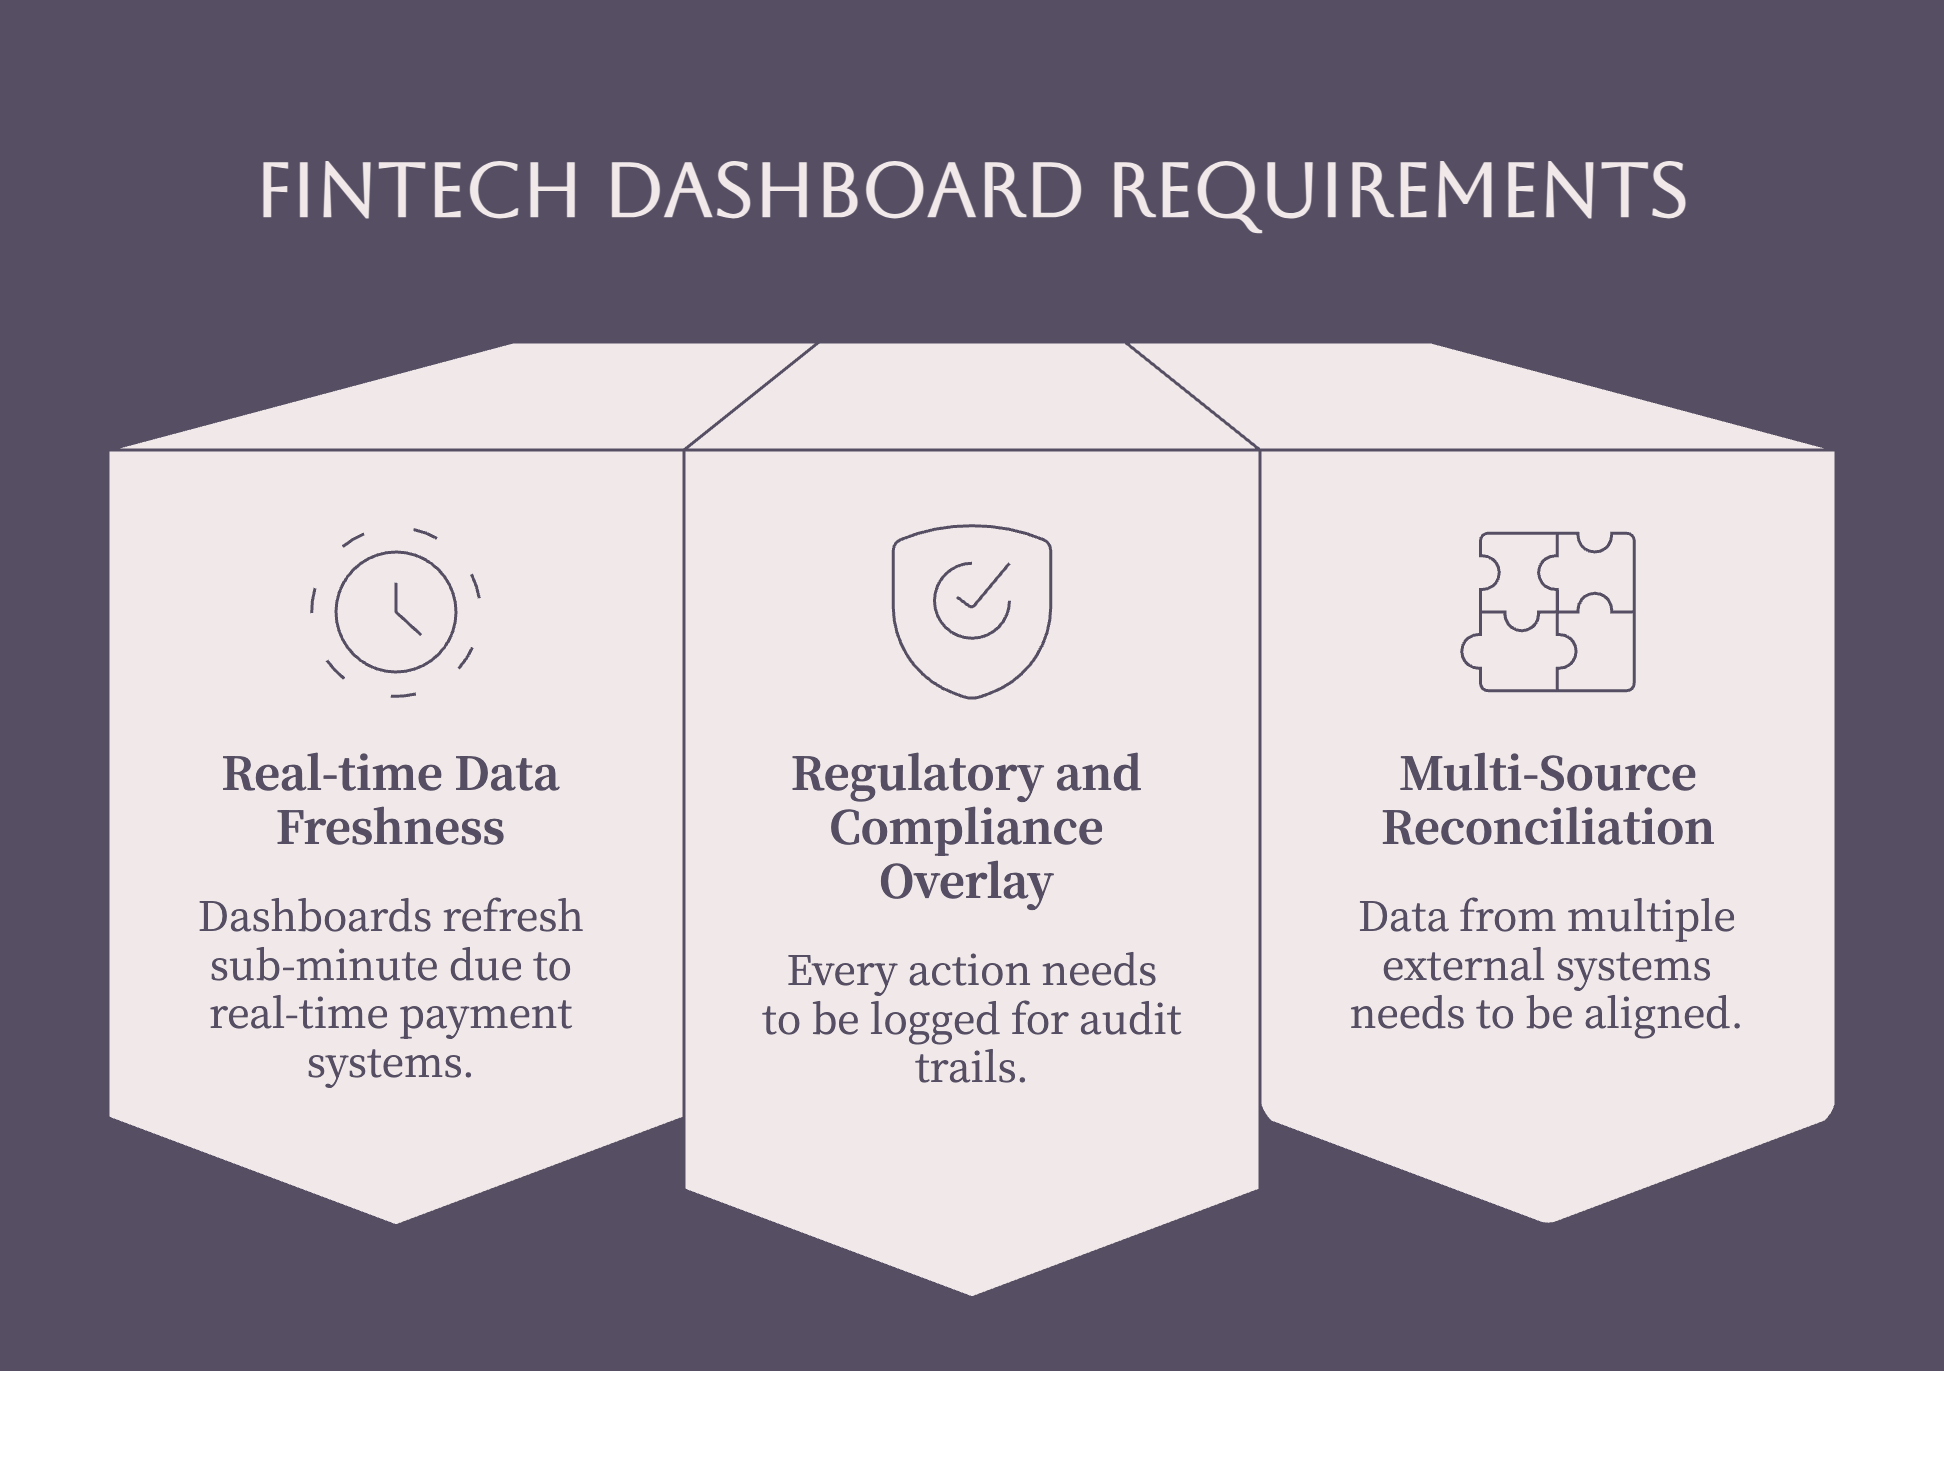
1. Real-time data freshness
Card-network operations dashboards used to refresh hourly. In 2026 they refresh sub-minute, because real-time rails (FedNow, RTP, SEPA Instant, UPI) made faster-than-batch the baseline customers expect. Fast payment systems keep gaining ground year over year across major economies, per the BIS Committee on Payments and Market Infrastructures (CPMI Brief No. 12, April 2026), and the analytics architecture has to keep pace.
The implication is structural. A single OLTP database serving both transactional writes and analytics reads breaks early at fintech scale. The pattern we see across implementations: writes go to a transactional store (Postgres), reads go to a columnar OLAP layer (ClickHouse, Snowflake), and change-data-capture pipelines bridge the two.
2. Regulatory and compliance overlay
Every view, export, and drill-down needs to be logged with user, timestamp, IP, and accessed-data scope. That log feeds SOC 2 evidence collection, AML inspection, and PCI-DSS audit trails for products in scope. Generic BI tools rarely ship this level of audit logging, and bolting it on after launch is painful. Role-based access control and a documented security and compliance posture stop being nice-to-haves the day your first bank partner sends a due-diligence questionnaire.
3. Multi-source reconciliation as the baseline
Data arrives from 5-15 external systems with disagreeing schemas: sales channels, payment gateways, banks, KYC providers, fraud engines, ledgers. The dashboard is where they have to align. Same transaction identified across all sources, exceptions surfaced, manual-match workflow available. Generic dashboard templates assume you have a clean dataset. Fintech dashboards start from five datasets that disagree.
The 6 Fintech Dashboard Archetypes
Six archetypes cover roughly 95% of the fintech dashboard examples you'll actually ship: payments, lending, neobank/account, wealth-tech, CFO-stack/reconciliation, and compliance/risk. Designing one omnibus dashboard for all six personas is the most reliable way to serve none of them, because their KPIs, data sources, and freshness SLAs barely overlap.
1. Payments Dashboard
Audience: Merchant operations, payments product managers, head of risk at a payments fintech.
KPIs surfaced: Live transaction volume, success rate, decline rate by reason code, dispute rate, settlement timing P50/P90/P99, fraud rate in basis points, authorization rate by issuer, processing fee yield.
Data sources: Payment gateway (Stripe, Adyen, Razorpay, Checkout.com), card networks via processor, bank settlement files, fraud engine outputs, ledger entries.
Refresh cadence: Sub-minute for live volume and decline rate. Hourly for fraud rate and authorization-by-issuer trends. Daily for settlement reconciliation.
Design notes: Above-the-fold real estate goes to the live volume sparkline and decline-rate trend. Decline-by-reason-code is the most-used drill path. Put a data-freshness indicator on every section: an operations team acts on a 5-minute-old payments dashboard very differently than a 5-second-old one.
2. Lending Dashboard
Audience: Head of credit, head of risk, portfolio manager, lending product PMs.
KPIs surfaced: Origination volume, approval rate, charge-off rate by cohort, default rate by origination month, average ticket size, portfolio yield (net interest margin), early-repayment rate, time-to-decision.
Data sources: Loan-origination system, underwriting decision engine, payment processor for repayments, credit bureau pulls, internal ledger.
Refresh cadence: Daily for portfolio metrics. Sub-minute for the live underwriting queue and queue depth.
Design notes: The cohort grid (default rate by origination month, plotted over months from origination) is the canonical lending visualization and the most-screenshot section in every lending dashboard we've seen. Graph approval rate and ticket size by underwriting cohort, not just by reporting period: cohort drift is the leading indicator of underwriting model decay.
3. Neobank / Account Dashboard
Audience: Account-product PMs, head of growth, head of operations, head of support.
KPIs surfaced: DAU/MAU, funded-account ratio, deposit balance distribution, transaction frequency, KYC funnel completion, dormancy rate at 30/60/90 days, NPS movement.
Data sources: Internal ledger, KYC and open banking API providers (Plaid, Persona, Onfido, Sumsub), payment rails, support ticketing, NPS tooling.
Refresh cadence: Daily for engagement metrics. Hourly for the KYC funnel. Sub-hour for risk-touchpoint events.
Design notes: Funded-account ratio belongs above the fold. It's the single number separating a neobank with revenue from a neobank with vanity metrics. Cohort retention curves are the second-most-used drill path, and dormancy rate drives re-engagement targeting. Tracking account usage patterns over time comes down to cohort retention plus dormancy segmentation for most account products.
4. Wealth-Tech / Wealth Management Dashboard
Audience: Investment-product PMs, advisor operations, head of investment, compliance.
KPIs surfaced: AUM, net flows, allocation drift vs target, return vs benchmark (tracking error), fee yield in basis points, advisor-to-account ratio, funding-cohort retention.
Data sources: Custodial brokerage data, market data feeds, allocation engine, advisor case management, internal ledger.
Refresh cadence: Daily at market close for AUM, drift, and benchmark comparison. Hourly for net flows. Sub-minute for advisor-terminal views during market hours.
Design notes: The customer-facing wealth management dashboard and the advisor-facing one diverge hard. Customers want return-vs-benchmark and progress toward goal. Advisors want allocation drift, rebalance-pending counts, and concentration-risk alerts. One dashboard for both fails both.
5. CFO-Stack / Reconciliation Dashboard
Audience: CFOs and finance teams at your customers: retail businesses, F&B operators, multi-channel sellers, SaaS finance teams.
KPIs surfaced: Reconciliation status (matched, unmatched, partial), exception queue depth, 13-week rolling cashflow forecast, payout latency P50/P90/P99, collections aging (DSO), gross margin variance vs forecast.
Data sources: Sales channels (Shopify, Amazon, marketplaces), payment gateways, bank statement integrations (Plaid, direct bank API, statement OCR), logistics platforms for COD reconciliation, internal ledger.
Refresh cadence: Hourly for reconciliation status and the exception queue. Daily for the cashflow forecast. Sub-hour for payout-latency alerts.
Design notes: Reconciliation is the most underbuilt dashboard category in fintech. Finance teams still rebuild these views in spreadsheets every month because the in-product version misses the exception-handling workflow. The exception workflow (one-click match override, manual reconciliation, exception assignment) matters more than happy-path matching speed, because exceptions are where the manual labor actually lives.
6. Compliance / Risk Officer Dashboard
Audience: AML/BSA compliance officers, head of risk, internal audit.
KPIs surfaced: AML alert volume, alert-to-SAR conversion ratio, KYC funnel completion, sanctions-screening hit rate, monitoring-rule effectiveness, SAR filing rate, regulator-inquiry response status.
Data sources: Transaction monitoring system, KYC provider, sanctions screening (OFAC, EU, UN lists), case management, regulator correspondence tracking.
Refresh cadence: Hourly for the alert queue and case status. Daily for trend metrics. Sub-hour for sanctions hits that need immediate action.
Design notes: Heavy work-queue patterns: alert lists with state, assignee, age, severity. The KPIs measure the program's effectiveness over time; the queue measures today's operational state. Both usually need to live on one screen, because the team monitoring effectiveness is the team working the queue.
The 6 Archetypes at a Glance
Which Fintech Dashboard Should You Build First?
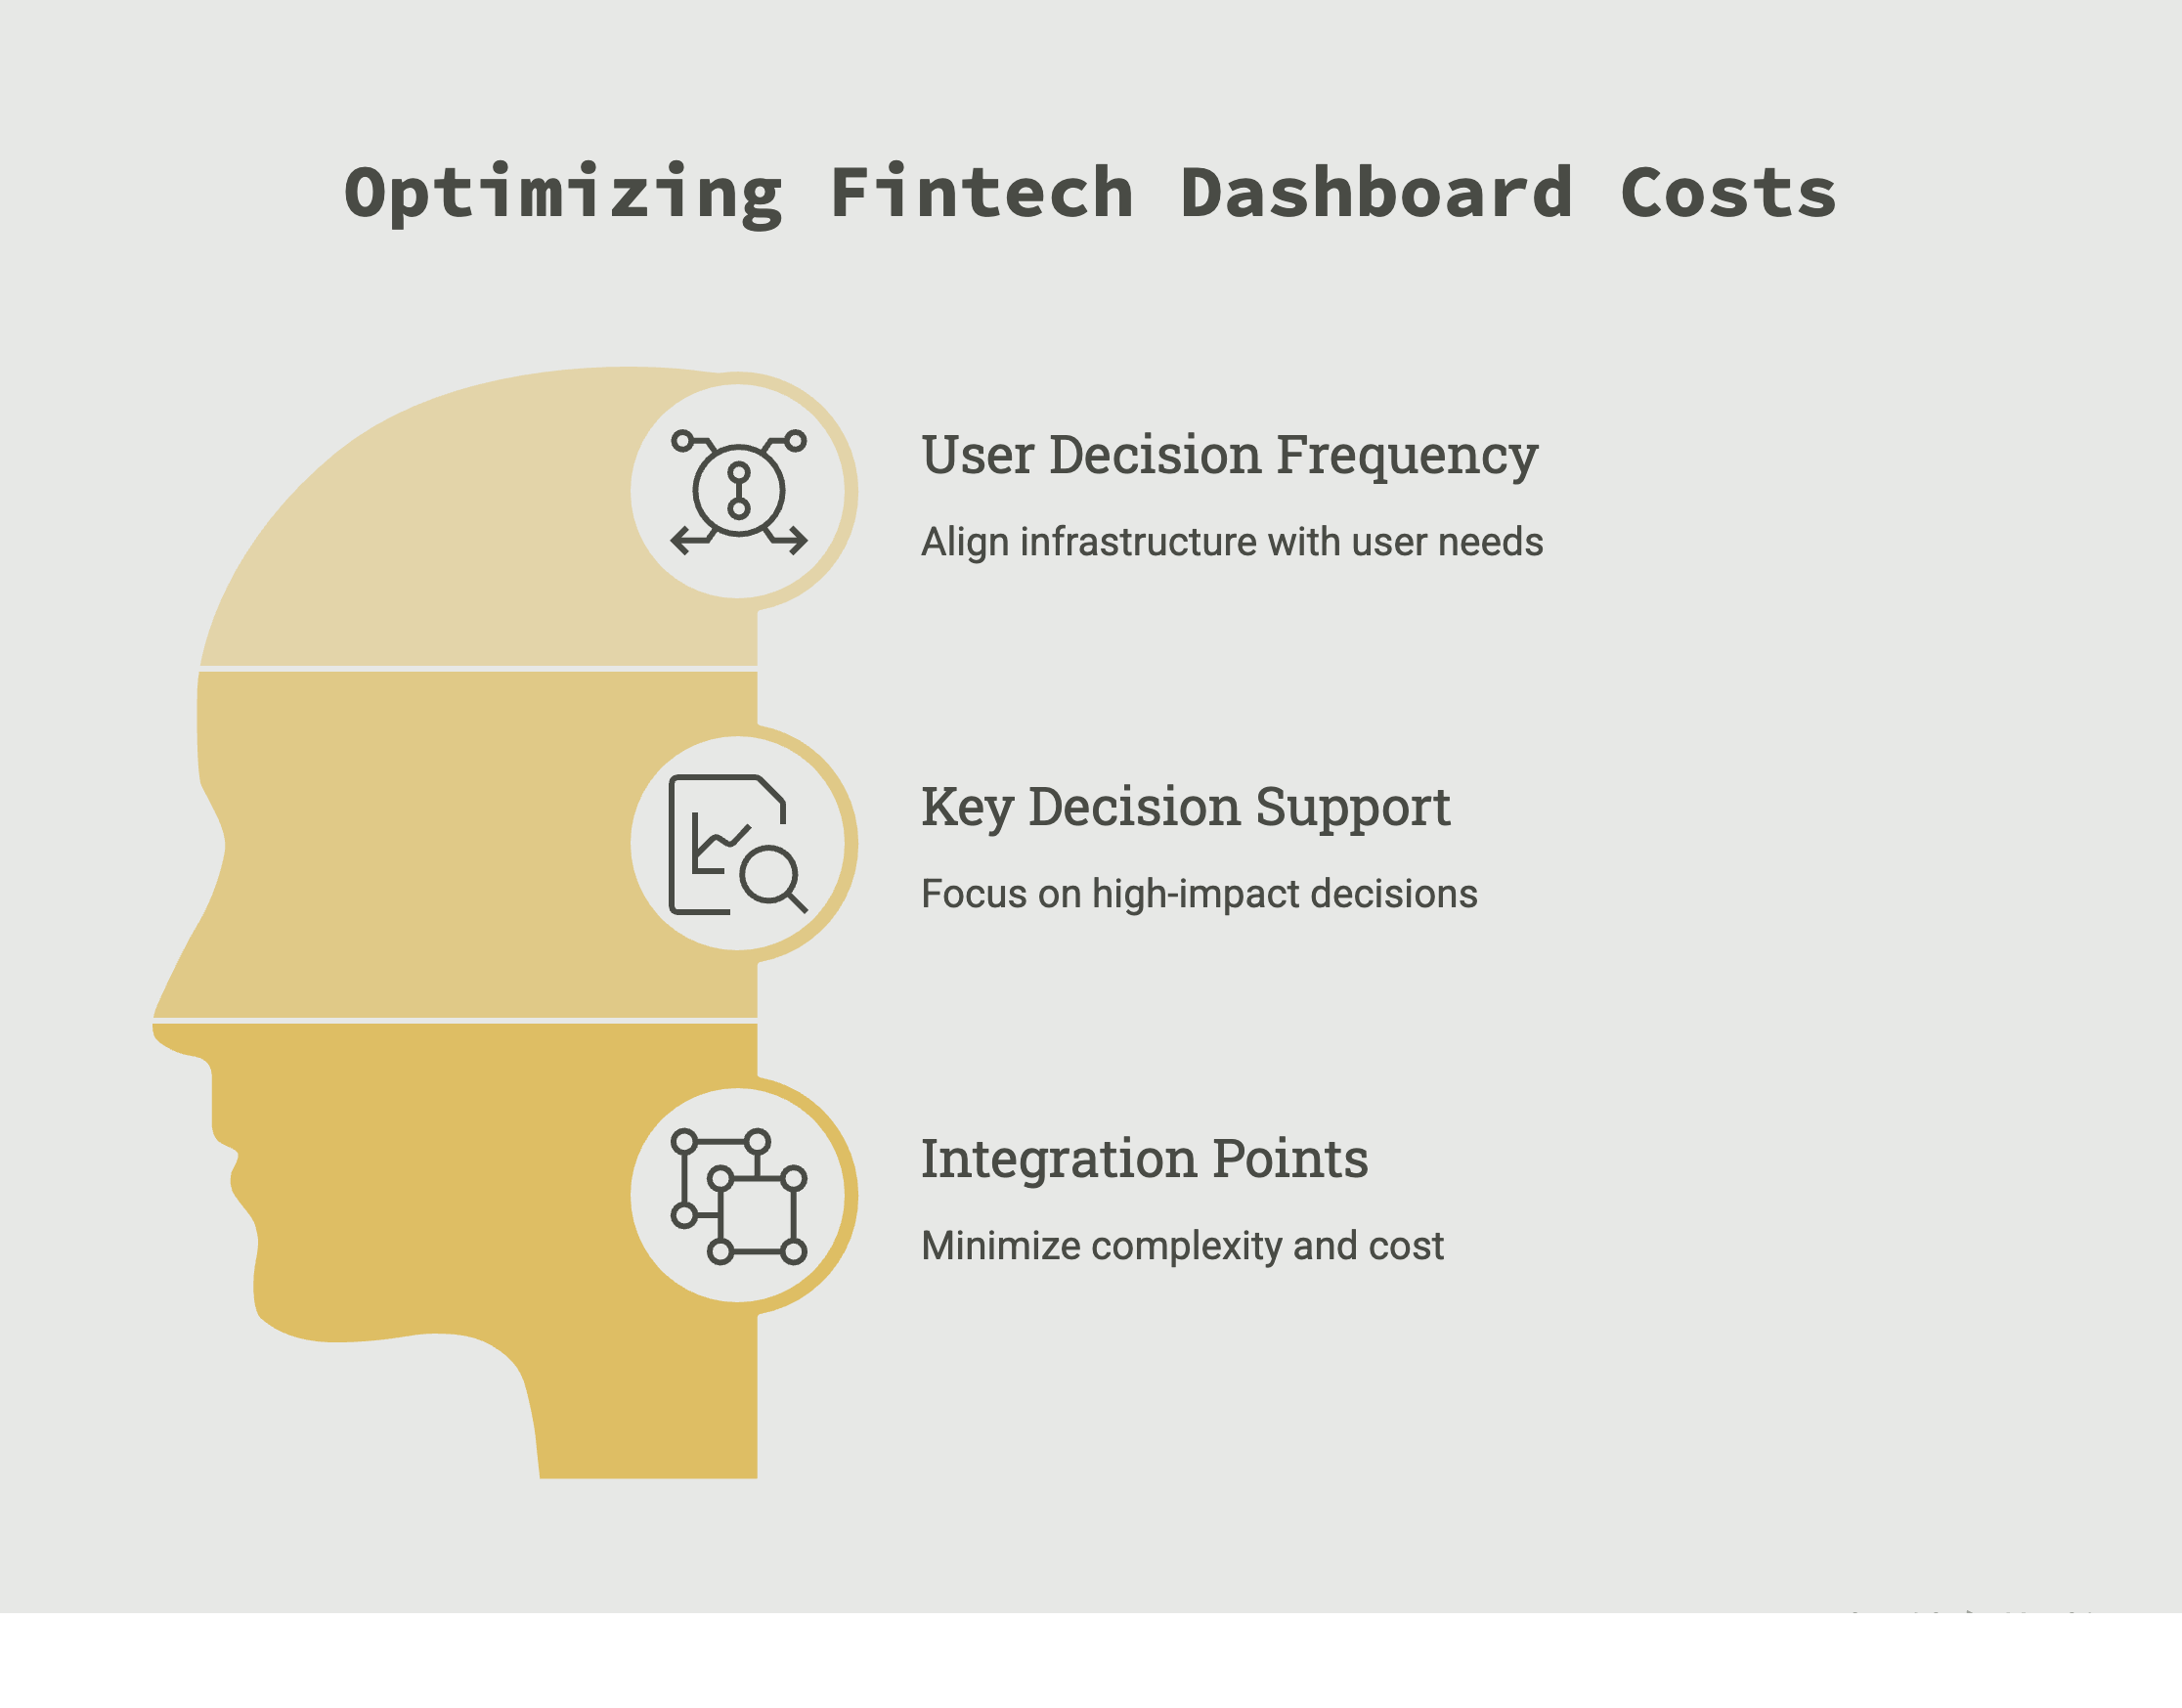
Three questions settle most sequencing decisions, and they matter because the wrong first dashboard burns your integration budget on infrastructure the decision cadence never needed.
1. Who is the primary user, and how often do they decide on this data? Hourly-decision operations teams justify sub-minute infrastructure. A weekly-review executive justifies daily refresh. Building sub-minute pipes for a weekly decision is the most common over-spend we see in fintech analytics.
2. What's the single most expensive decision this dashboard supports? Dashboard ROI is usually dominated by one or two decisions per audience: fraud-threshold tuning for payments ops, underwriting-model updates for lending, exception triage for CFO-stack. Build around that decision, not the category.
3. How many integration points does the data need, and what's the freshest source? A reconciliation dashboard pulling from 8 systems costs structurally more than a single-gateway payments dashboard. Integration cost dominates dashboard cost in most fintech stacks.
How Should You Visualize the Data in Your Fintech Dashboard?
Fintech visualization has stricter precision requirements than generic data viz, and the stakes are concrete: a 2-pixel misread on a trading chart is a wrong trade; on a cashflow chart it's a missed bill. The fix that survives is pairing every decision-critical chart with an exact-value label and a data-freshness timestamp, a convention Bloomberg and LSEG (Refinitiv) terminals have used for decades. The embedded data visualization patterns below apply to any stack.
Three constraints separate this work from generic dashboarding:
- Decision precision. A marketing funnel tolerates "around 60% conversion." A treasury dashboard does not.
- Regulatory disclosure context. Loan-decision summaries and investment-performance views are documents regulators inspect. Visualization standards here follow accessibility law (US ADA, EU EAA) and sector rules (FCA Consumer Duty, CFPB UDAAP), not just design taste.
- Real-time plus historical blending. "Transaction volume this hour: 1,247" means nothing without "vs same hour last week: 980" next to it.
The 7 Chart Types Fintech Teams Use Most
Seven chart types cover about 90% of fintech dashboard design patterns in production, and each carries a rule for when never to use it.
One addition worth knowing about: for fraud rings spanning connected accounts, graph/network visualization is becoming the standard companion to heatmaps, because ring structures are invisible in aggregates. More on that in the FAQ.
Color Coding for Financial Data (Including Dark Mode)
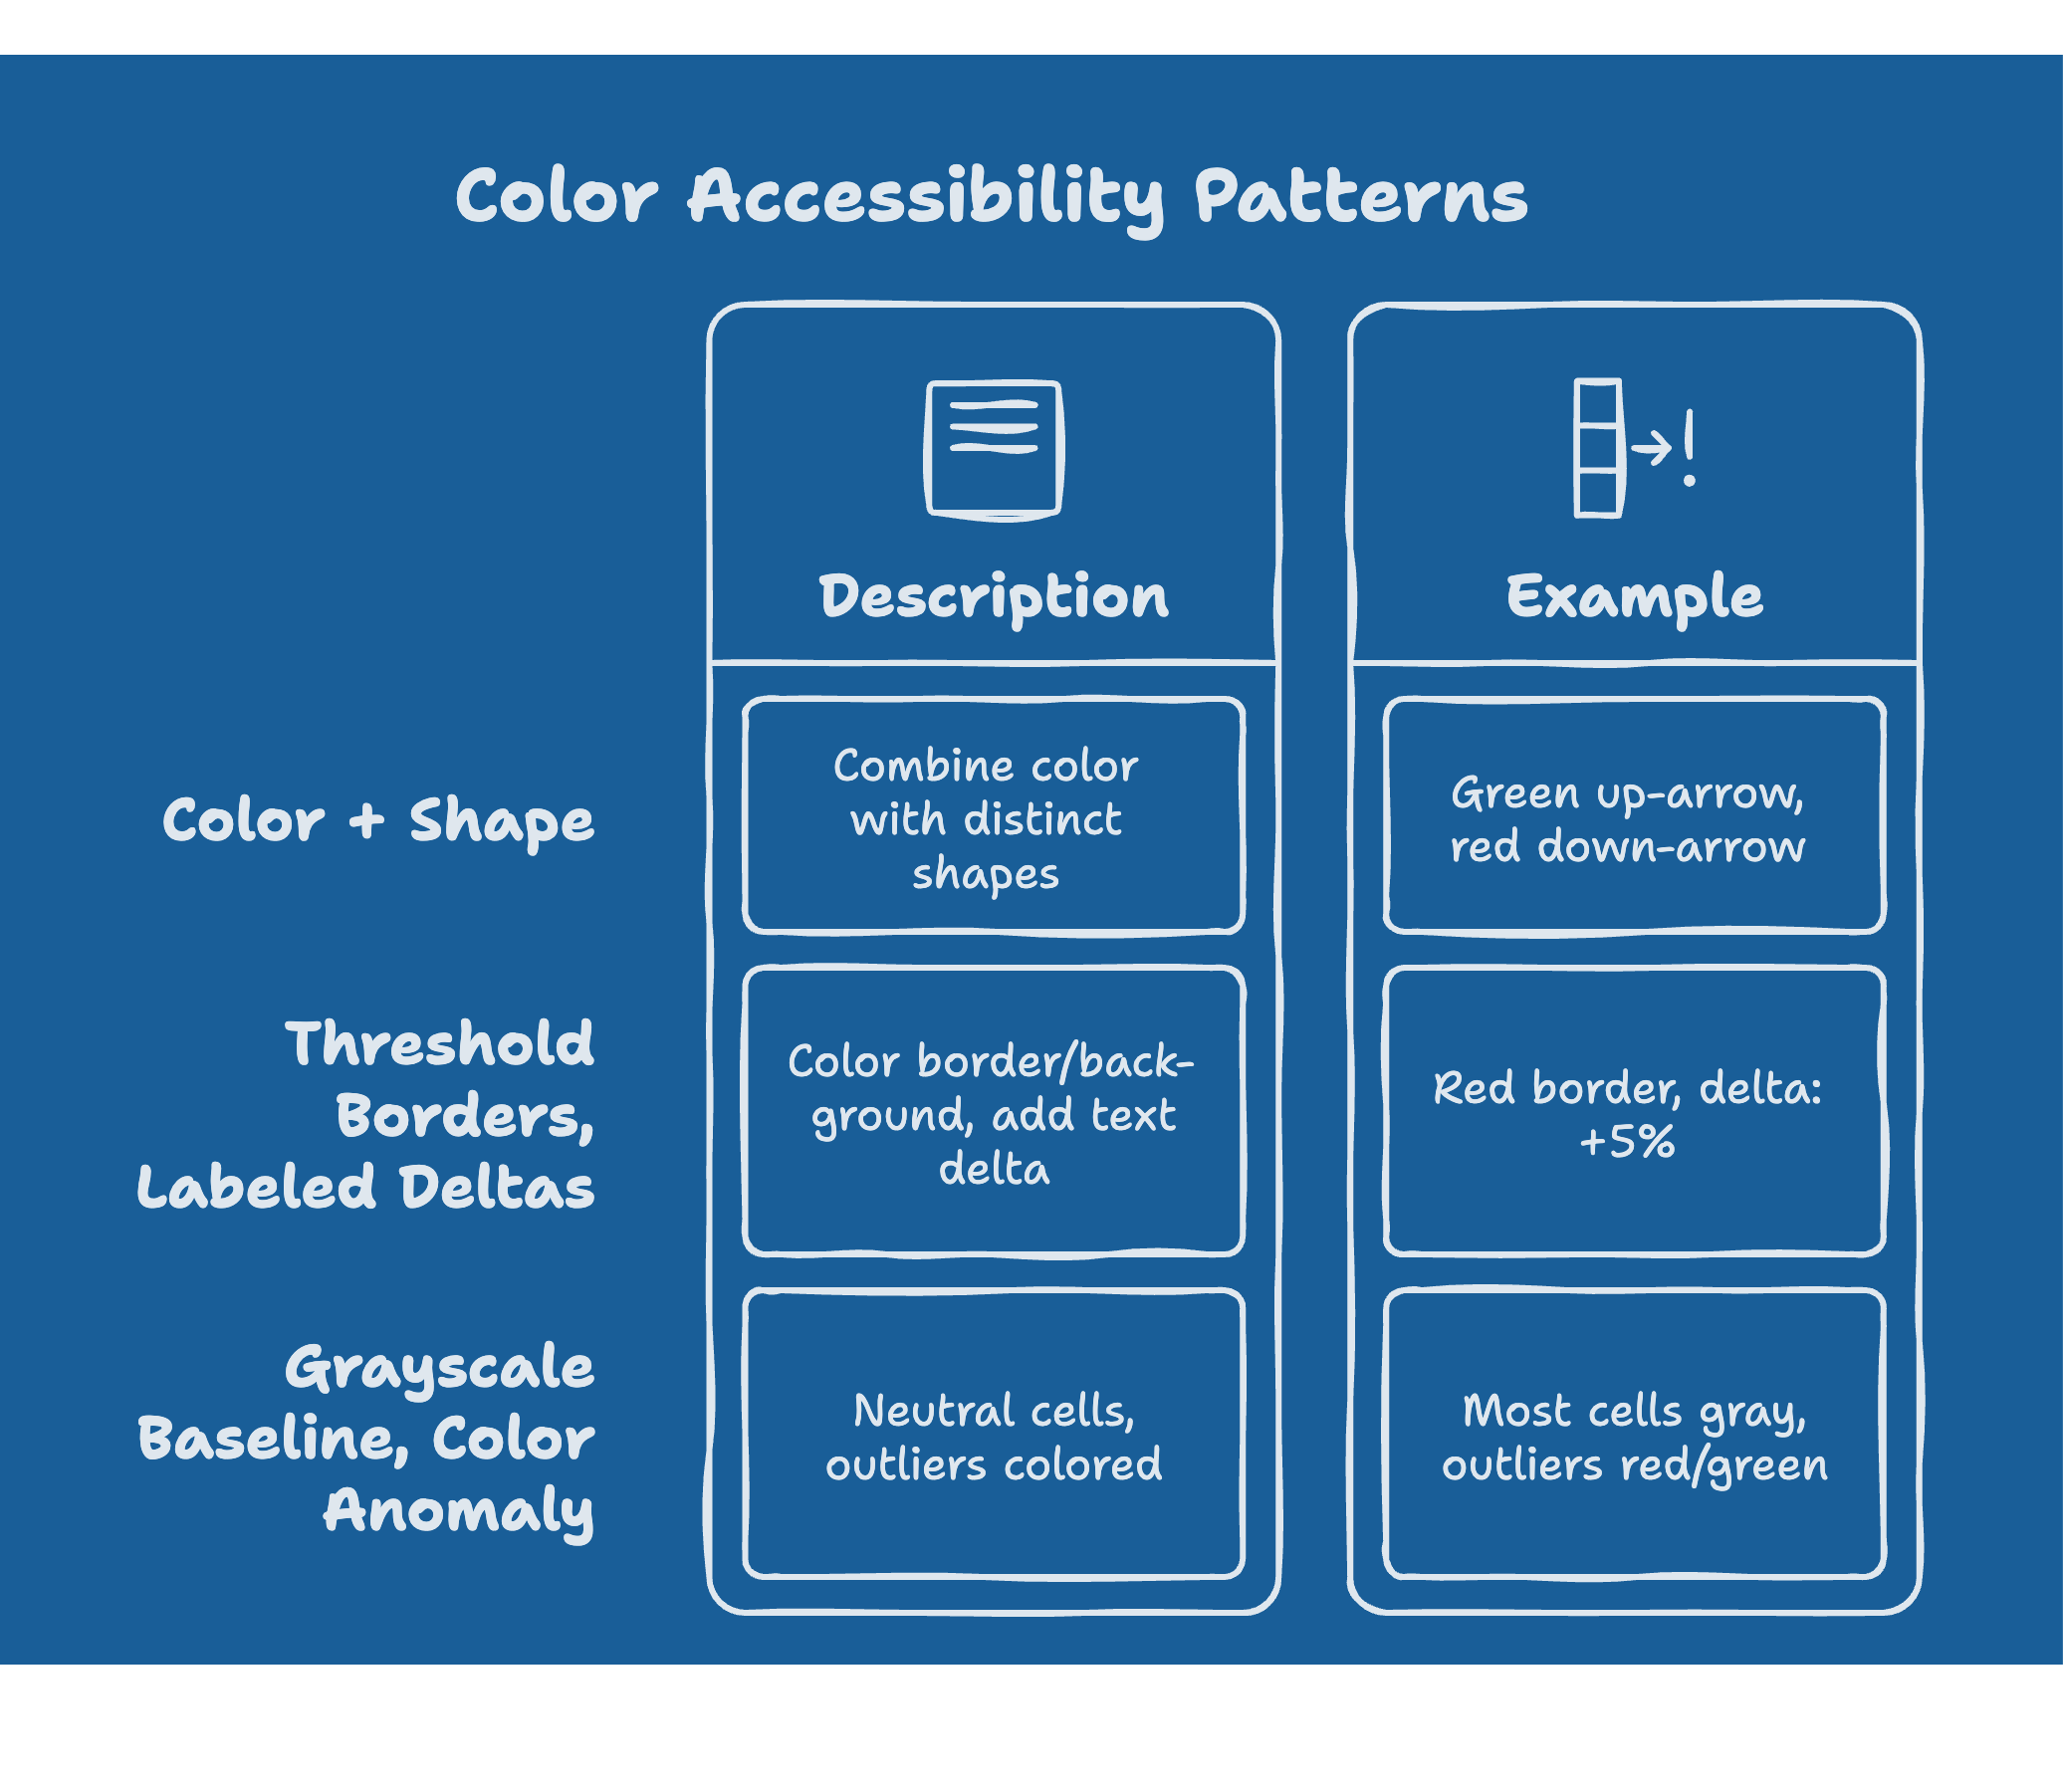
Color cannot be the only means of conveying information, per W3C WCAG 2.2. Red/green-only encoding fails for roughly 1 in 12 men and 1 in 200 women with color vision deficiency (Colour Blind Awareness), and for products selling into banking or government, accessibility is also a contractual obligation under Section 508 and the EAA.
Three patterns solve it:
- Pair color with shape. Green up-arrow and red down-arrow, not green cell and red cell.
- Threshold borders, labeled deltas. Color the border or background, put the actual delta in text.
- Grayscale baseline, color on anomaly only. Most cells stay neutral; only outliers get red or green. This doubles as visual-noise reduction.
For variance-from-baseline data, the standard pairing is red-amber-green for status thresholds and blue scales for directional data where movement isn't inherently good or bad. Grayscale is the safe default for any audience that hasn't lived with the chart for months: a CFO opening a quarterly view needs less aggressive encoding than a fraud analyst reading the same screen daily.
Dark mode deserves explicit design time, not an inversion filter. Fintech dashboards skew dark-mode-heavy (operations teams staring at screens for hours), and naive inversion breaks both contrast ratios and the red/green semantics above. Test every status color against WCAG contrast requirements on the dark background, and re-check that anomaly colors still pop against a near-black baseline instead of vibrating against it.
Real-Time vs Historical: The Layering Pattern
Real-time data without historical context is uninterpretable for financial decisions, so the standard pattern stacks three layers:
- Foreground: the live value.
- Midground: comparison context (prior period, target, benchmark).
- Background: a rolling 30-day range band showing where "normal" sits.
A payments cell built this way reads: "Decline rate: 2.3% (vs 1.8% last hour, normal range 1.5-2.1%)." Without the range, that 2.3% triggers a false alarm or gets ignored. With it, the operator sees outside-normal and acts.
Anti-Patterns: Real Examples of Misleading Financial Data Visualization
Most misleading financial charts aren't malicious; they're defaults nobody overrode. These are the offenders we see most in fintech products:
- 3D charts. Always reduce accuracy. There is no fintech case where 3D communicates better than 2D.
- Dual-axis charts. Two metrics on different scales sharing one chart manufacture false correlation. Use small multiples.
- Pie charts past 5 segments. Slice comparison fails; use a horizontal stacked bar.
- Truncated y-axes on money charts. A revenue line starting at $9.5M makes a flat quarter look like a cliff. Start at zero or annotate the truncation loudly.
- Unmodified chart-library defaults. Recharts, Highcharts, ECharts, and Chart.js ship gradient fills that distort perception, tooltips without freshness timestamps, and palettes that fail accessibility checks. Budget the first hours of any integration for overriding defaults.
- Mixed currencies on one axis. Without explicit conversion rate and timestamp, the chart destroys the precision it exists to deliver.
- Hidden time zones. "Today's volume" without a TZ annotation is the most common starting point of a reconciliation failure.
Embedded Fintech Dashboards: Build or Embed?
The build-vs-embed decision hits at two layers: dashboard delivery (tenant isolation, audit logging, white-labeling) and visualization (chart-type and color configuration). In our experience, building the delivery layer in-house runs 6 to 12 engineering months. Not because rendering charts is hard, but because multi-tenant analytics architecture, audit logging, and SOC 2 / PCI-DSS evidence collection are expensive to get right. The dashboard is the easy part: multi-tenancy, row-level security, per-tenant configuration, caching at scale, SSO, and ongoing maintenance are where the real time goes.
Embedded analytics platforms flip the split. Chart types and color encoding stay configurable per dashboard, so the design decisions in this guide remain yours, while rendering, tenant scoping, and audit logging come pre-built.
The pattern we keep seeing at CFO-stack fintechs makes the case concrete: a seed-stage reconciliation product serving retail and F&B finance teams needs multi-source reconciliation views, customer-facing dashboards, and natural-language queries on day one, and none of that differentiates them enough to justify building the plumbing. See how SpotDraft switched from Looker, saved $300k annually, and went live in just 4 weeks. Read the SpotDraft case study.
The full strategy framework (maturity levels, decision math, tools comparison) is in embedded analytics for fintech SaaS. The technical breakdown (reference architecture, RLS implementation, code samples) is in building embedded fintech dashboards. For custom builds, start with a JavaScript chart libraries comparison.
Ship the Dashboard Layer Without Building It
If you're building fintech SaaS (CFO-stack, lending, payments, neobank, wealth-tech, spend management) and the dashboard layer is a customer-facing surface, embedding is usually the practical path: faster to ship, lower engineering overhead, native to the workflow it sits inside. Analytics built for financial services teams like DataBrain ship with multi-tenancy, compliance audit logging, real-time ingestion, and configurable chart and color patterns pre-built.
Sources
This guide draws on the following verified references (all URLs checked live, July 2026):
- CB Insights, State of Fintech Q1 2026. https://www.cbinsights.com/research/report/fintech-trends-q1-2026/ - fintech investment concentration by segment.
- BIS / CPMI Brief No. 12, "Fast payments are gaining ground" (April 2026). https://www.bis.org/statistics/payment_stats/commentary2604.htm - fast-payments growth underlying the sub-minute freshness requirement.
- Plaid, Resources. https://plaid.com/resources/ - consumer-fintech data-source and KYC patterns.
- Edward Tufte, The Visual Display of Quantitative Information. https://www.edwardtufte.com/book/the-visual-display-of-quantitative-information/ - data-ink ratio and chart design fundamentals.
- Stephen Few, Information Dashboard Design (2nd ed.). https://www.perceptualedge.com/library.php - grayscale-baseline and exception-coloring patterns for financial dashboards.
- W3C WCAG 2.2, Understanding "Use of Color." https://www.w3.org/WAI/WCAG22/Understanding/use-of-color.html - color must not be the sole means of conveying information.
- Colour Blind Awareness. https://www.colourblindawareness.org/colour-blindness/ - color vision deficiency prevalence (1 in 12 men, 1 in 200 women).
For complementary reading, see fintech data analytics, fintech KPIs and metrics, and financial dashboards.
About the author
Vishnupriya B is a Data Analyst at DataBrain specializing in data visualization, SQL, Python, and data modeling. She works on fintech, procurement, and supply-chain analytics implementations across the DataBrain customer base and writes about the dashboard archetypes and chart-design patterns that hold up at scale versus the ones that get rebuilt in twelve months.
Frequently Asked Questions
What's the difference between a fintech dashboard and a banking BI dashboard?
A banking BI dashboard typically serves an internal audience (credit committee, ALCO, regulators) on daily-or-slower cadence over a single source of truth (the core banking system). A fintech dashboard serves either the fintech's customers (in-product analytics) or operations teams (real-time monitoring) over data that arrives from 5–15 external systems on sub-minute cadence. The architectural pattern, audience, and freshness expectations all differ.
What data sources do fintech dashboards typically integrate?
Common sources by archetype: Payments - Stripe / Adyen / Razorpay, card networks, bank settlement files, fraud engines. Lending - loan-origination system, underwriting engine, credit bureaus, payment processors. Neobank - internal ledger, KYC providers (Plaid / Persona / Onfido), payment rails, customer-support tooling. CFO-stack reconciliation - sales channels, payment gateways, bank statements (Plaid or direct), logistics platforms, ledger.
How fresh does the data need to be for a payments dashboard in 2026?
Sub-minute for live transaction volume and decline-rate trends. Hourly is acceptable for fraud-rate and authorization-by-issuer trends. Daily is acceptable for settlement reconciliation. The freshness requirement scales with the decisioning cadence - operations teams act on near-real-time signals during business hours, so the dashboard needs to keep up.
What's the regulatory minimum for retention on a fintech dashboard's underlying data?
Highly jurisdiction- and product-dependent. AML transaction-monitoring data typically requires 5+ years retention under FATF guidance and equivalent local rules. PCI-DSS scoped data has its own retention rules per PCI Security Standards Council v4.0. For consumer-financial data covered by CFPB Section 1033 or PSD3, retention rules align with broader open-banking consent terms. Most fintech architectures retain transaction data 7+ years to cover the longest-applicable rule.
How do fintech dashboards handle multi-currency reporting?
Three common patterns: (1) report in account-base-currency only with a separate FX-exposure dashboard for treasury teams, (2) report in user-selected display currency with FX-rate timestamp visible, (3) dual-display (transaction currency + base currency side by side). Pattern 1 is most common; pattern 3 is preferred for treasury-focused dashboards. Avoid mixing currencies on a single chart axis without explicit conversion-rate annotation - it's the most common visualization-trust failure in finance dashboards.


