
Ecommerce Dashboard: 15 KPIs, Templates & Real Examples for Data-Driven Retail (2026)

.png)
Key Takeaways
- Revenue Per Visitor (RPV) is the single most important KPI for your ecommerce dashboard, it ties traffic quality directly to revenue.
- Dashboards with 8-12 focused widgets hit 85% daily usage. Cluttered ones? About 40%.
- 80% of companies using real-time analytics reported direct revenue improvement.
- Role-specific dashboards beat one-size-fits-all views every time, your CMO and warehouse manager don't need the same screen.
- If you're building a marketplace or ecommerce SaaS, embedded analytics is no longer optional. It's expected.
- Stop building from scratch. Databrain ships in weeks, not months.
Most ecommerce teams operate with data scattered across five or six disconnected tools: sales in one place, marketing in another, operations somewhere else and none of them talk to each other. The result is fragmented reporting, delayed decisions, and revenue leaks that go unnoticed for days.
The cost of this fragmentation is measurable. 80% of companies that adopted real-time analytics reported direct revenue improvement. Not better reporting. Better results. Yet the majority of online retailers still piece together their performance picture from disconnected sources and stale spreadsheets.
This article is built to close that gap. We break down the 15 KPIs that belong on every ecommerce dashboard, walk through role-specific templates that teams actually use daily, compare the leading tools on the market in 2026, and cover a critical angle most guides miss entirely: how to embed analytics directly into your product so your merchants and sellers get insights without leaving your platform.
What Is an Ecommerce Dashboard?
Strip away the marketing language and an ecommerce dashboard is just one screen that pulls sales, marketing, fulfillment, and customer data into the same place. Instead of bouncing between admin, your Google Analytics property, Meta Ads Manager, and whatever your ops team uses for shipping you look at one view. That’s it.
Simple concept. Surprisingly hard to get right.
Two Kinds You Should Know About
Internal dashboards are what most people picture. Your exec team checking revenue targets. Your marketer is watching ROAS. Your warehouse lead tracking fulfillment speed. They face inwardly.
Customer-facing dashboards are a completely different animal. These are analytics you build INTO your product. If you run a marketplace or an ecommerce SaaS, your merchants and sellers want to see their own numbers inside your app not get redirected to some separate login. The tools, the architecture, even the design thinking is different. We’ll get into this later because honestly, it’s the angle almost nobody talks about.
Why Ecommerce Dashboards Actually Move the Needle
Data-driven retailers see 28% higher revenue lift and 35% better retention.
Nice stat. But what does that look like day to day?
You Catch Problems Before They Bleed Revenue
Your checkout completion rate drops 12% on a Tuesday afternoon. Without a real-time ecommerce analytics dashboard, you might not notice until Friday’s report. With one, someone on your team flags it before lunch. Maybe it’s a broken payment gateway. Maybe a promo code is glitching. Either way you stopped the bleeding in hours, not days.
Decisions Get Sharper (and Faster)
When your pricing data, ad spend, CRM, and fulfillment numbers all live in one place, you stop arguing about whose spreadsheet is right. The team aligns around the same numbers. Decisions speed up. That’s not theory, that's what happens when you remove the friction between “I think” and “I can see.”
Most of Your Competitors Are Still Guessing
73% of ecommerce teams don’t have actionable dashboards. Read that again. Three out of four competitors in your space are working with partial visibility. A focused ecommerce KPI dashboard doesn’t just help you; it puts you in a different league than teams still relying on gut feel and monthly CSV dumps.
Benchmarking Gives Your Numbers Context
Knowing your conversion rate is 2.1% is useless in a vacuum. Knowing the median for your vertical is 3.2%? Now you know exactly where to dig. Good dashboards make that comparison easy.
What Makes a Good Ecommerce Dashboard in 2026?
Not every dashboard is created equal. The ones that actually get used and actually drive decisions share a few non-negotiable traits.
Real-time or near-real-time data. Static reports from yesterday are a liability in ecommerce. If your checkout flow breaks at 10 AM and you don't find out until the next morning's CSV, you've lost an entire business day of revenue. Your dashboard should reflect what's happening now, not what happened last week.
Role-specific views. A CMO tracking ROAS (Return On Ad Spend) and a warehouse manager watching fulfillment speed have nothing in common on their screens. One dashboard for everyone means nobody gets the view they actually need. Build separate views for each function.
Mobile-responsive design. Your marketing lead checks numbers from bed at 7 AM. Your CEO glances between meetings on an iPad. If it doesn't render clean on mobile, half your audience never sees the data.
Actionable alerts, not just displays. A dashboard that passively shows numbers is decoration. The good ones push alerts when something swings hard, sudden conversion drops, inventory running low, ROAS crashing on a campaign. Proactive beats reactive every time.
Clean, focused layout. Dashboards with 8-12 focused widgets hit 85% daily usage. Cluttered ones sit around 40%. Most important KPIs go top-left, that's where eyes land first. If a new team member can't make sense of it in 30 seconds, it's too complicated.
15 Ecommerce Dashboard KPIs That Actually Deserve Your Attention
Not 50. Not “all the metrics”. Fifteen. These are the ones that consistently show up in the dashboards of ecommerce teams that are growing profitably, not just growing.
Revenue Metrics
Revenue Per Visitor (RPV) deserves to be at the top. It rolls conversion rate and average order value into a single number that ties traffic quality directly to your bottom line. If you had to pick one KPI for your ecommerce dashboard, this is the one.
Round it out with Average Order Value (AOV) to understand transaction size, Gross Merchandise Volume (GMV) for the big picture, and Revenue by Channel so you know which sources are actually pulling their weight.

Conversion Metrics
Your overall conversion rate (healthy range: 2-3.5%) gives you the headline, but it hides a lot. Where exactly are people dropping off? That’s why you break it into Cart Abandonment Rate (try to stay under 65%), Checkout Completion Rate, and Add-to-Cart Rate. Most conversion problems start way before the payment page. Tracking these individually shows you where.

Customer Metrics
CAC (Customer Acquisition Cost) and CLV (Customer Lifetime Value) together answer the question: “Is our growth profitable, or just expensive?” Your CLV should run at least 3x your CAC. If it doesn’t, you’re buying customers at a loss no matter how good the revenue line looks.
Layer in Cohort Retention Rate to see if loyalty is trending up or slowly eroding and NPS for a qualitative gut-check on customer sentiment.

Operational Metrics
Inventory Turnover, Fulfillment Speed, and Return Rate don’t get the spotlight, but they quietly destroy margin when they go sideways. Slow-moving stock ties up cash. Slow shipping kills repeat purchases. High returns eat profit. Your ops team needs these front and center on their ecommerce metrics dashboard.

Quick Reference: KPI Table
How to Choose the Right KPIs for Your Business
Fifteen KPIs is the master list. You don't need all of them on day one. Picking the right ones depends on where your business actually is right now.
If you're early-stage or launching a new channel, focus on conversion rate, AOV, and CAC first. You need to know whether your unit economics work before you optimize anything else. Everything else is noise until these three are healthy.
If you're scaling and profitable, layer in RPV, CLV, cohort retention, and revenue by channel. These tell you whether growth is sustainable or just expensive. A rising revenue line means nothing if your CLV:CAC ratio is underwater.
If you're running a marketplace or multi-vendor platform, add GMV, fulfillment speed, and return rate. Your merchants care about operational reliability as much as revenue. And if you're embedding analytics into your product, these are the KPIs your sellers will want to see in their own dashboards.
One rule that applies everywhere: start with the decisions your team makes every day and work backward to the KPIs that inform those decisions. Don't start with "what data do we have", start with "what calls do we need to make faster?"
Ecommerce Dashboard Templates That People Actually Use
A dashboard nobody opens is just a decoration. The trick is building role-specific views that answer one question fast. Dashboards with 8-12 focused widgets hit 85% daily usage. Cluttered ones? About 40%. Less really is more here.
Executive Overview
Revenue vs. target. Orders vs. last period. Conversion trend. Top traffic sources. That’s it. Your CEO should be able to answer “are we having a good day?” in under 30 seconds. Add anomaly alerts for anything that swings more than 15% off the 7-day average.

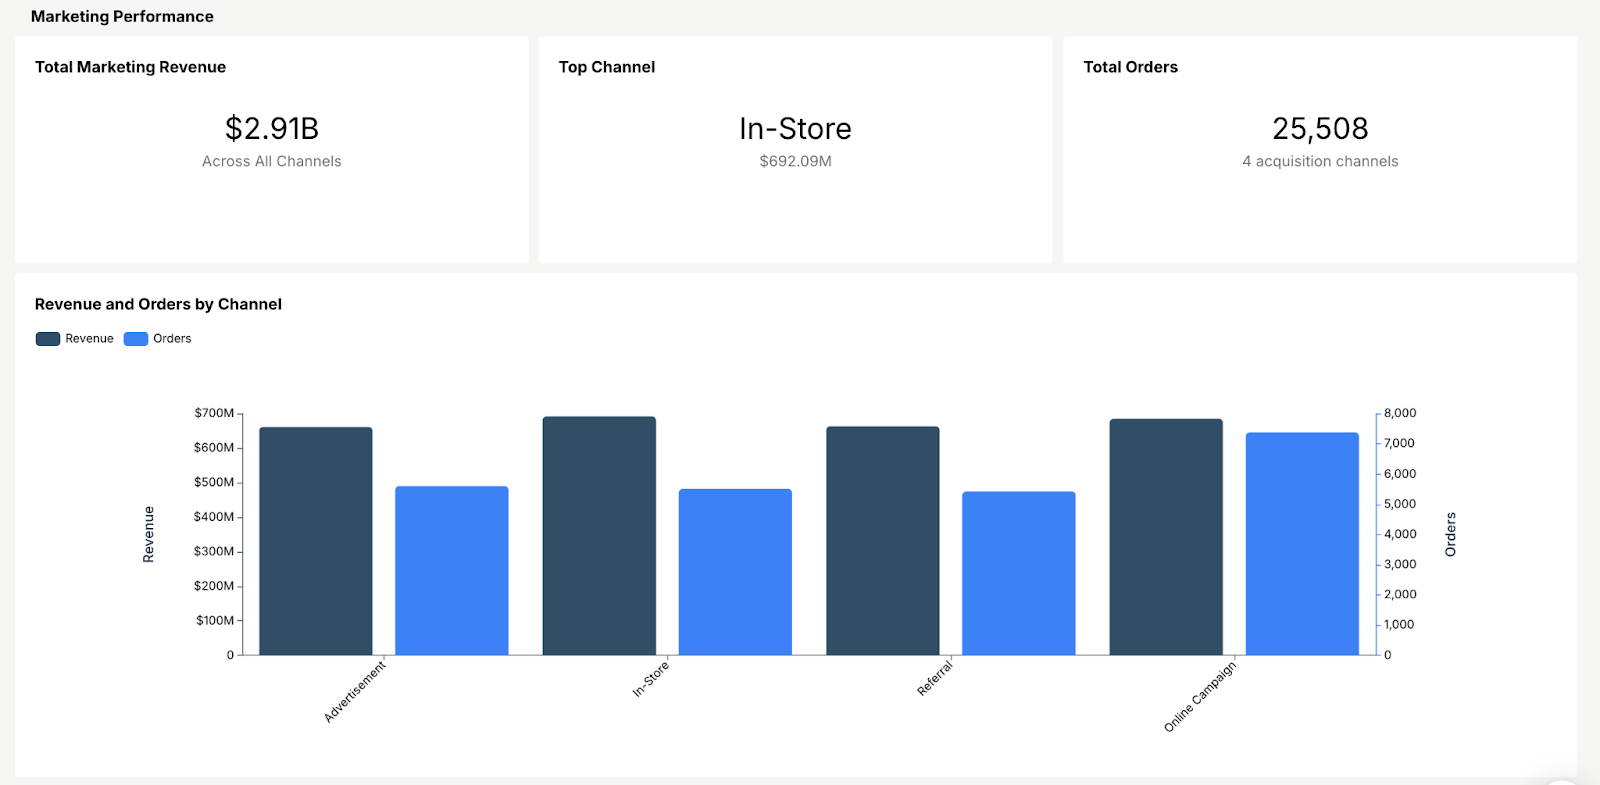
Marketing Performance
ROAS by channel, CAC movement, campaign-level click-through and cost per acquisition, email and SMS numbers, and critical attribution from multiple angles. Running only last-click attribution in 2026 means you’re systematically undervaluing your organic and social channels. Show first-touch, last-touch, and data-driven models side by side.
Inventory & Fulfillment
Stock levels with reorder triggers, fulfillment time by warehouse or 3PL, supplier reliability scores, and return rates broken down by product category. This is the dashboard that turns reactive “oh no we’re out of stock” into proactive planning. Use historical sales patterns to forecast demand before it hits.

Customer Analytics
Cohort retention curves, CLV by acquisition source, NPS trends, and behavior breakdowns by segment. This view tells you whether your customers are getting stickier or slowly ghosting. For a deeper dive, check out our comparison of customer-facing analytics vs. traditional BI.

Multi-Channel Sales
Selling on Shopify, Amazon, and maybe wholesale? You need revenue, margin, and conversion by channel side by side. This is where a proper ecommerce reporting dashboard earns its keep: it shows which channels drive actual profit, not just top-line vanity numbers.

Want to see this live? Databrain’s interactive retail dashboard shows these templates with real data you can click around in.
Building Your Ecommerce Dashboard: A Practical Walkthrough
Start With Decisions, Not Data
Before you pick a tool, ask each team: “What decisions do you make every day, every week, every quarter?” Map those decisions to specific KPIs. Your exec needs RPV and revenue trends. Your marketer needs CAC and ROAS. Your ops lead needs fulfillment speed and inventory turnover. Work backward from the decision, not forward from “what data do we have”.
Connect Your Sources and Automate the Sync
Pull data from your CRM, ad platforms, and shipping systems. The non-negotiable part: it has to sync automatically. If someone’s doing manual CSV exports into a spreadsheet, your dashboard was stale before anyone opened it.
Pick a Tool That Fits Your Actual Use Case
Internal team dashboards? Geckoboard and Databox are solid. Heavy enterprise analytics? Tableau or Looker. Building analytics into your own SaaS product for merchants to use? That’s embedded analytics territory and it’s a fundamentally different architecture. More on tools in the comparison below.
Design Like Someone’s Going to Use This at 7 AM on Their Phone
Clean layout. Clear labels. Minimal colors. Most important KPIs top-left (that’s where eyes land first). If a new team member can’t make sense of it in 30 seconds, it’s too complicated. Pare it back. For more on this, our data visualization best practices guide goes deeper.
Automate Reports and Alerts
Set up daily or weekly email summaries. Configure real-time alerts for anything that swings hard sudden conversion drops, inventory running low, ROAS crashing on a specific campaign. A dashboard that nobody remembers to check is just expensive furniture.
Launch Small, Then Widen
Roll it out to a handful of people first. Get their honest feedback. Tweak. Then go abroad. Review your KPI selection every quarter. What mattered in January might not be the priority in June.
How AI Is Changing Ecommerce Dashboards in 2026
Dashboards have historically been passive. They show you numbers and wait for you to notice something. That's changing fast.
AI-powered anomaly detection flags problems before a human would catch them. A 12% drop in checkout completion on a Tuesday afternoon? An AI layer surfaces that in real time, tags the likely cause, and pushes an alert to the right person. No one has to be staring at a screen at the right moment.
Natural language querying lets non-technical team members ask questions in plain English. Instead of building a custom report, your head of marketing types "show me ROAS by channel for the last 30 days" and get the answer immediately. This collapses the gap between question and insight from days to seconds.
Predictive KPIs are moving from nice-to-have to standard. Dashboards that forecast inventory depletion dates, predict CLV at the cohort level, or flag at-risk customers before they churn are becoming table stakes for competitive ecommerce teams.
AI-generated summaries sit on top of dashboards and give you a plain-English brief: "Revenue is up 8% week-over-week, driven primarily by a 15% lift in organic traffic. Cart abandonment spiked on mobile investigate checkout UX." This saves your team from interpreting charts and gets them straight to decisions.
For teams exploring this space, our article on AI-powered analytics covers what's production-ready today and what's still hype.
Ecommerce Dashboard Tools: Honest Comparison [2026]
Every tool serves a different scenario. Picking the wrong one wastes months.
If you’re a Shopify-only store, the built-in analytics cover the basics. Multi-channel brands needing everything in one view should look at Databox or Geckoboard. Enterprise operations with big budgets lean toward Tableau or Looker.
But if you’re a marketplace or ecommerce SaaS that needs to put dashboards inside your product for your merchants that’s a different game entirely. And that’s where Databrain comes in.
How to Pick the Right Dashboard Tool for Your Ecommerce Business
The comparison table above shows what's available. Here's how to actually make the decision.
Ask one question first: Is this dashboard only for your internal team, or do your customers and merchants need analytics inside your product too?
If it's purely internal and you're running a single-source store, basic built-in analytics might cover the essentials for now. But the moment you need multi-source reporting, custom KPIs, or role-based views across teams, you've outgrown basic tools.
And if it's customer-facing, meaning your merchants, sellers, or end users need to see their own data inside your platform, you're in embedded analytics territory. That's where Databrain fits. You're not buying a BI tool. You're buying components that drop directly into your existing app. Multi-tenancy, row-level security, branding customization, and SDK integration matter far more than the number of chart types in a catalog.
Three red flags to watch for when evaluating any dashboard tool:
Your team needs more than one login to see all their data. If the tool doesn't connect to every source you need out of the box, integration costs will eat your timeline. Databrain connects natively to Snowflake, BigQuery, Databricks, and PostgreSQL, the warehouses ecommerce teams actually use.
The tool looks great in the demo but nobody opens it after week two. Ask for real usage metrics from reference customers, not just feature lists. Embedded dashboards solve this by default analytics lives where your users already work, inside your product.
You're locked into per-seat pricing for a tool your whole company needs access to. At 50+ users, per-seat models get expensive fast. Databrain's usage-based pricing scales with your platform, not your headcount.
Embedding Ecommerce Dashboards in Your Own Platform
Your merchants don’t want to log into a separate analytics tool. They want to see their sales, their customers, their inventory right inside your app. If you’re building a marketplace or multi-vendor platform in 2026, embedded analytics isn’t a nice extra. It’s expected.
The problem? Building this from scratch is brutal. Data pipelines. Visualization components. Multi-tenancy so each seller only sees their own numbers. Maintaining the whole thing as you ship new features. Most engineering teams estimate 6+ months for a custom build.
Databrain exists specifically for this. It plugs into your cloud data warehouse: Snowflake, BigQuery, Databricks, PostgreSQL and gives you embeddable React components that drop into your existing UI. Row-level security handles the multi-tenancy automatically. Each merchant gets their own secure view.
The results speak: ecommerce SaaS platforms that embed analytics report 40% more time users spend in-app, lower churn (turns out analytics is a sticky feature), and new upsell revenue from premium dashboard tiers. Your product delivers Tableau-quality insights natively, with your branding, at a fraction of the cost.
For teams weighing build vs. embed: start with a pre-built retail analytics template and customize from there. Also worth reading up on self-service analytics and AI-powered analytics to see where embedded BI is heading.
Mistakes That Kill Ecommerce Dashboards (We See These Constantly)
1. Cramming 25 Widgets Into One Screen
If a metric doesn’t directly inform a decision somebody makes this week, take it off the main view. Archive it in a secondary report. Nobody’s going to scroll past widget 18 to find the number they actually need.
2. Forgetting That People Use Phones
Your marketing lead checks numbers at 7 AM from bed. Your CEO glances at the dashboard between meetings on an iPad. If it doesn’t render clean on mobile, half your audience never sees the data. Responsive design isn’t optional.
3. Treating a Weekly PDF as a Dashboard
Static reports are a rearview mirror. In ecommerce, the gap between real-time data and yesterday’s data can be a broken checkout page going unnoticed for an entire business day. That’s real revenue, gone.
4. One Dashboard for Everyone
Your CMO and your warehouse manager don’t need the same screen. Build role-based views. Each team sees the metrics that drive their decisions. Nothing more.
Ecommerce Dashboard Best Practices: A Quick Checklist
Before you launch (or relaunch) your dashboard, run through this list.
Data layer: All sources connected and syncing automatically. No manual CSV exports. Refresh cadence matches decision speed real-time for ops, daily for strategy.
Design: 8-12 widgets max per view. Most critical KPIs top-left. Clean labels. Minimal color palette. Mobile-responsive.
Role specificity: Separate views for exec, marketing, ops, and customer success. Each view answers one question fast.
Alerts: Anomaly detection configured for conversion drops, inventory lows, and ROAS crashes. Alerts pushed via Slack, email, or SMS, not just visible on the dashboard.
Review cadence: KPI selection reviewed quarterly. Dashboard layouts updated based on actual usage data. Widgets nobody clicks get removed.
Access control: Row-level security if customer-facing. SSO integration for internal dashboards. No shared passwords.
Documentation: Every KPI has a written definition, formula, and benchmark visible on hover or in a linked glossary. No ambiguity about what a number means.
Look, the teams winning in ecommerce right now aren’t the ones swimming in the most data. They’re the ones who built focused, role-specific dashboards and actually use them to make faster calls. That’s the whole game.
Pick your 15 KPIs. Build the views your team will actually open every morning. And if you’re building analytics into your own platform, stop spending engineering cycles reinventing charting libraries. See how Databrain’s embedded analytics works and ship it in weeks.
You already have the data. Go build the system that turns it into decisions.
Frequently Asked Questions
What KPIs belong on an ecommerce dashboard?
At minimum: Revenue Per Visitor, conversion rate, AOV, cart abandonment, CLV, CAC, and cohort retention. RPV matters most because it ties traffic quality to revenue in one number. Everything else builds context around it.
What does an ecommerce dashboard typically cost?
Free options like Shopify’s built-in analytics and GA4 cover the basics. Dedicated tools (Geckoboard, Databox) run $40-$75/month. Enterprise platforms: Tableau costs $70+/user/month. Embeddable solutions: Databrain uses usage-based pricing, which suits SaaS platforms that need customer-facing analytics.
Can I put an ecommerce dashboard inside my own product?
Yes. Embedded analytics platforms: Databrain gives you SDKs to integrate branded dashboards directly into your app. Your merchants see their numbers inside your product, not a separate tool.
How do I build an ecommerce dashboard from scratch?
Start with decisions, not data. Ask each team what calls they make daily and weekly, then map those decisions to specific KPIs. Connect your data sources (CRM, ad platforms, shipping) with automated syncing. Choose a tool that fits your use case. Design for mobile-first, keep layouts clean, and launch small before rolling out company-wide.
What's the difference between an ecommerce dashboard and a BI tool?
A BI tool (like Tableau or Looker) is a general-purpose analytics platform designed for analysts. An ecommerce dashboard is a focused, role-specific view built around retail KPIs for daily decision-making. BI tools offer more flexibility but require more setup and expertise. Dashboards prioritize speed-to-insight for non-technical users.


