
.png)
Key Takeaways
• Embedded analytics integrates dashboards, reports, and AI-powered insights directly into your product, allowing users to access and act on data within the tools they already use.
• Purpose-built platforms ship in 2–4 weeks vs 12–18 months building in-house, at a fraction of the engineering cost
• Analytics users churn 30–40% less than non-analytics users – it’s a retention strategy, not just a feature.
• The architecture is based on four foundational components: data connectivity, a semantic and metric layer, multi-tenant security, and a rendering layer such as an iFrame, SDK, or API.
• Predictable flat-rate pricing (typically $999 to $1,995 per month for unlimited viewers) eliminates the per-user “growth tax” which can make enterprise BI tools expensive as your user base grows.
• Begin by focusing on three to five high-impact use cases to demonstrate ROI, then expand over time rather than attempting to build comprehensive analytics coverage for every user and scenario in the initial phase.
Your customers are paying for your product, then opening a spreadsheet to figure out if it's working.
That disconnect is showing up in your retention numbers, your upgrade rates, and the deals where a competitor demoed something you're still planning to build.
Product teams at this stage of evaluation already know the problem. The question is whether embedded analytics gets prioritized this quarter or gets pushed to a roadmap that never quite arrives.
This guide exists to make that decision easier with a clear framework covering architecture, build vs. buy economics, real-world embedded analytics examples, and what it actually takes to ship in weeks, not quarters.
What Is Embedded Analytics?
Embedded Analytics Definition: Embedded analytics is the practice of integrating dashboards, reports, charts, and data-driven experiences directly into a software application so that users can see and act on insights without ever leaving the tool they already use.
It sounds simple. The implications are enormous.
The traditional approach to analytics looks like this: data lives in a warehouse, analysts build dashboards in a separate BI tool, business users get a PDF or a shared link, they look at it once, and then they go back to making decisions based on gut instinct. The cycle takes 24-48 hours at minimum. Often much longer.
Embedded analytics collapses that cycle entirely. Instead of exporting a CSV and opening Tableau, your user sees a live embedded analytics dashboard, showing their data right inside the product they're already using. Insight and action happen in the same place, at the same time.
That's not a UX improvement. That's a structural change in how embedded analytics creates value.
The old workflow: Export CSV → Open BI tool → Build report → Share PDF → Wait for someone to act
The embedded analytics workflow: The right metric → In front of the right user → At the right moment → In the same interface where they act
The difference is measured in hours, decisions, and ultimately dollars. Faster decisions mean fewer churned customers, fewer missed opportunities, and more revenue from customers who can prove the ROI of your product to their executives.
How Does Embedded Analytics Work?
Understanding the mechanics is what separates teams that implement embedded analytics smoothly from teams that burn three months and still don't have anything in production.
.png)
The architecture has four core layers working together.
Layer 1: Data Connectivity
Everything starts with your data sources. Your embedded analytics layer needs to connect to wherever your data lives: a product database (PostgreSQL, MySQL), a cloud data warehouse (Snowflake, BigQuery, Redshift), a CRM, an event stream, or some combination of all of them.
The connection method matters. Direct warehouse connectivity (querying Snowflake or BigQuery live) gives you real-time accuracy but requires query optimization to stay fast. Pre-aggregated data layers are faster but require more upfront data modeling.
Layer 2: Semantic and Metric Layer
Raw database tables don't mean anything to business users. A semantic layer translates database columns into business concepts. "active_users_7d" becomes "Weekly Active Users." "arr_expansion_delta" becomes "Expansion Revenue."
This layer is also where metric governance happens. When you define "active user" once and enforce it everywhere, you stop having the conversation where Sales says churn is 4% and Finance says it's 7% and nobody trusts any number. Consistency here is a competitive advantage.
Layer 3: Multi-Tenancy and Security
This is where SaaS analytics gets genuinely hard to build from scratch.
You have 500 customers. Every single one of them must see only their own data. Not just approximately their own data exactly their own data, with zero risk of data leakage across tenants. That requires row-level security, tenant isolation, and access control enforced at the query level.
Databrain handles this via guest tokens. You provision a tenant programmatically with zero manual configuration per customer. The platform enforces isolation automatically. Building this correctly from scratch typically takes a team of engineers 6-12 months.
Layer 4: Rendering and Integration
The analytics layer generates visualizations: charts, tables, KPI cards, funnels, heatmaps and delivers them into your application UI. How they're delivered determines UX quality and integration flexibility. There are three methods, covered in depth later in this article: iFrames, JavaScript/React SDK components, and API-first rendering.
Databrain uses native React SDK components, true DOM integration, not iFrame wrappers so your analytics render as if it were built natively into your product. No visual seams, no performance lag, no foreign-feeling UI.
Get started with Databrain's documentation →
Who Is Embedded Analytics For?
Embedded analytics for product teams comes down to one pressure: shipping analytics features without absorbing an 18-month engineering dependency. That's an intentionally wide net. Let's get specific about the roles that benefit most and what each one is actually trying to solve.
Product Managers
PMs want to ship analytics features without becoming dependent on an 18-month engineering project. They're measuring time-to-market, user adoption rates, and whether analytics features justify a premium pricing tier. Their nightmare is building a "reports" section that nobody uses because it requires a second login or a 10-step export process.
What they need: fast implementation, a self-serve exploration layer for end users, and flexible dashboard templates they can iterate on without engineering tickets.
Developers and Engineering Leads
Engineers care about integration quality SDK documentation, API clarity, authentication patterns, and how the analytics layer plays with the existing stack. They want to know: how long does this actually take to integrate? What breaks when our data model changes? How do we handle schema migrations?
What they need: well-documented SDKs, clear multi-tenancy patterns, React component that drop into existing component libraries, and direct warehouse connectivity that doesn't require a separate ETL pipeline.
CTOs and Co-founders
CTOs are thinking five layers up. Build vs buy economics. Vendor lock-in risk. Total cost of ownership over 3 years. Whether the analytics platform can scale from 200 to 20,000 tenants without a re-architecture. Whether enterprise customers will flag the vendor in security reviews.
What they need: flat-rate pricing that doesn't explode at scale, SOC 2 Type II compliance, programmatic multi-tenancy, and a vendor that's not going to get acqui-hired and sunset in 18 months.
Data and Analytics Leaders
Data leaders want governance. Consistent metric definitions, row-level security, audit logging, and a way to enforce data quality across a growing customer base without manually configuring 500 workspaces. They've seen what happens when every team defines "active user" differently.
What they need: a semantic layer with centralized metric definitions, role-based access control, data lineage tracking, and compliance certifications that survive enterprise security reviews.
Customer Success Teams
CSMs want to know which customers are at risk before those customers send a cancellation email. They want embedded churn indicators, usage dashboards, and health scores inside the CS console not in a separate BI tool that requires a separate login and a separate interpretation layer. SpotDraft applied this directly, embedding real-time usage signals and account health scores into their CS workflow so their team could act on risk indicators long before a contract renewal was ever in question.
What they need: real-time usage data, embedded health scores, and workflow-adjacent insights that trigger playbooks automatically instead of requiring manual analysis.
Your End Customers
The users inside your product don't think about analytics architecture at all. They just want their questions answered without being redirected somewhere else. "How are we performing this month?" should be answerable in two clicks inside your product. Not via a CSV export or a meeting with your analytics team.
What they need: clean, fast, role-specific dashboards that answer their actual questions and let them drill down without a tutorial.
Embedded Analytics vs Traditional BI: When to Use Which
The question "embedded analytics or traditional BI?" has a clear answer for most use cases. Understanding the difference prevents expensive mistakes in both directions.
Choose embedded analytics when:
- Analytics belongs inside your product experience
- Your users are customers or non-technical business users
- You want to monetize analytics as a feature or premium tier
- Time-to-market is a competitive constraint
- You're serving hundreds or thousands of tenants
Choose traditional BI when:
- You're doing internal, cross-functional reporting for your own organization
- Your users are analysts, finance teams, or BI specialists
- You need heavy-duty SQL exploration and ad hoc modeling
- You already have strong internal BI adoption and mature processes
What Is Embedded BI? (And How It Differs from Embedded Analytics)
.png)
Embedded BI Definition: Embedded business intelligence (embedded BI) is the delivery of dashboards, reports, and self-service data exploration inside another software application instead of a standalone BI tool. Users see and act on their data in the product they already use, with no separate login and no context switch.
Most vendors treat "embedded BI" and "embedded analytics" as the same thing, and in everyday usage they are. But the two terms carry different histories, and that heritage shows up in architecture, pricing, and how native the result feels. If you are evaluating platforms, the distinction is worth two minutes.
Embedded BI vs Embedded Analytics: Same Goal, Different DNA
"Embedded BI" is the older term. It usually describes taking a business intelligence platform built for internal analysts (think Power BI, Tableau, Qlik, or Logi) and embedding its dashboards into another application. The platform's original assumptions come along for the ride: an analyst-grade interface, a single-organization data model, per-seat or per-viewer licensing, and iFrame delivery.
"Embedded analytics" is the newer usage: analytics purpose-built to live inside a customer-facing product. Multi-tenancy is the starting point, not a retrofit. Rendering happens through native SDK components instead of iFrames. White-labeling goes down to the component level. And pricing is typically flat, because the vendor expects your viewer count to be your entire customer base.
Neither approach is wrong. They are different design choices for different jobs. The practical rule is simple: if you are a SaaS company shipping dashboards to your own customers, you are shopping for embedded analytics, even if you typed "embedded BI" into Google. Everything in this guide applies to that evaluation.
How Embedded BI Differs from Traditional BI
This is the comparison most embedded BI guides lead with, and the answer is the comparison table earlier in this guide with one label swapped: traditional BI is a separate tool your analysts open; embedded BI puts those same capabilities inside the application where work happens. Where it lives, who uses it, adoption friction, and pricing model all flip. For the full breakdown of when each one wins, see the dedicated guide to embedded analytics vs business intelligence.
What Embedded BI Needs to Work in a Customer-Facing SaaS Product
Four requirements separate embedded BI that survives enterprise procurement from embedded BI that stalls at proof of concept:
- Multi-tenancy enforced at the query layer. Every customer must see exactly their own data. That means row-level security and tenant-aware tokens applied where queries execute, not visibility rules painted on in the UI. Ask a vendor where isolation is enforced; the answer tells you whether the platform was designed for customer-facing use.
- White-labeling below the logo. Chart palettes, card styling, system copy, and empty states all need to match your product, or the seam shows. The white-label embedded analytics guide covers how deep that control needs to go.
- Warehouse-native connectivity. The platform should query Snowflake, BigQuery, Redshift, or Postgres directly and reuse the models your data team already maintains, rather than copying your customers' data into its own store.
- A semantic layer that grounds AI. Natural language queries are now table stakes in embedded BI, and they are only trustworthy when every answer traces back to governed metric definitions and inherits the same row-level security as the dashboards. An ungrounded AI's wrong answers ship under your brand.
These four are the embedded BI-specific essentials; the "Key Features to Evaluate" section later in this guide covers the full evaluation checklist.
This is not theoretical. SpotDraft built customer-facing reporting on this foundation and went live in 4 weeks, saving roughly $300k in engineering cost.
Can You Just Embed the BI Tool You Already Have?
Sometimes, and for internal use cases it can be the right call: if your ops team lives in Power BI, keep it there. The trouble starts when the audience is your customers. iFrame embeds carry the BI tool's look and feel into your UI, per-viewer licensing turns your customer growth into a license bill, and tenancy bolted onto a single-organization data model is the first thing an enterprise security review pulls apart. If you are weighing this path, the embedded analytics tools comparison covers the embedding-capable BI platforms and the purpose-built alternatives side by side.
Why Embedded Analytics Matters in 2026
Three years ago, embedded analytics was a differentiator. Today, it's becoming a baseline expectation.
Here's what's changed and why it matters right now.
Decision latency is now a competitive liability.
Traditional analytics workflows create 24 to 48 hour gaps between data and action. In markets where your competitor can respond to a trend in hours, that gap is where you lose. Embedded analytics compresses decision time to seconds. Not minutes, just seconds. That's a different operational reality for any team using your product.
Your customers expect ROI visibility.
Modern buyers, especially B2B buyers, expect to see the value of the tools they're paying for, inside those tools. "Trust us, we're working" is not a retention strategy. Embedded analytics lets your customers open your product and immediately see: here's what I got from this. That's the difference between a vendor and a strategic asset.
Analytics features now directly drive retention.
The data on this is consistent across the industry: customers who regularly engage with analytics features churn at significantly lower rates typically 30-40% less than customers who don't. That's not a coincidence. Analytics increases product stickiness because it creates a data feedback loop. The more a customer's data lives inside your product, the harder it is to leave.
The competitive window is closing fast.
Two years ago, shipping embedded analytics put you ahead of 70% of your category. Today that number is shrinking. Your competitors are shipping it. If you're still on the "we'll build it eventually" roadmap, you're already behind in sales cycles where the other vendor demos real-time analytics and you describe it as "coming soon".
The good news: with Databrain, you can close the gap in weeks. The bad news: every quarter you wait, more deals go to someone who already shipped it.
Benefits of Embedded Analytics
The impact shows up fast and across more parts of the business than most teams expect.
Users engage more when insights appear inside the tools they already work in. Upgrade rates climb when there's a clear analytics tier to sell into. And customer retention strengthens because a product that runs someone's daily workflow is a product they don't leave.
Analytics users churn 30-40% less than those who don't use analytics features. That's not a soft benefit, it's a number that changes your NRR conversation at the board level. The full picture of embedded analytics benefits across retention, revenue, and productivity is worth understanding before you scope your implementation and actionable embedded analytics is where those benefits translate into specific decisions your team can make today.
The productivity gains are just as direct. Teams that used to wait days for a report now answer their own questions in minutes, without filing a ticket or switching tabs.
Embedded Analytics Use Cases by Industry
The embedded analytics use case is not one-size-fits-all. Here's how it plays out across major verticals with specific examples and the metrics that prove ROI.
SaaS and B2B Software
This is the highest-concentration use case. SaaS companies embed analytics to give customers real-time visibility into their own usage, outcomes, and ROI.
Specific examples:
A project management SaaS embeds team productivity dashboards showing task completion rates, cycle times, and sprint burndown directly inside the project view. Customers no longer need to export data to understand team performance. Analytics feature adoption reaches 68% within 90 days of launch. Churn among analytics users drops 34% vs non-users.
A billing platform embeds invoice status, days sales outstanding (DSO), and payment trend dashboards into the customer portal. Finance teams cancel their BI tool subscriptions because they no longer need them. The platform's NPS increased 18 points in the first two quarters.
An HR SaaS embeds attrition risk scores, hiring funnel performance, and compensation benchmark dashboards into the HR manager's home screen. Analytics becomes the primary reason enterprise customers renew. The platform wins a category award for "most innovative product feature".
Financial Services and Fintech
Finance teams run on data. The frustration is that the data is usually in four different places, and getting a consolidated view requires either a dedicated analyst or a painful manual export process.
Embedded analytics in fintech surfaces real-time cash flow dashboards, payment reconciliation status, transaction anomaly alerts, and portfolio performance KPIs directly inside the operational tools finance teams use daily.
Key use cases: Real-time cash flow visibility, payment aging analysis, fraud detection alerts embedded in transaction reviews, portfolio health dashboards, regulatory reporting automation, loan performance tracking for lending platforms.
The differentiator in this vertical: Speed and accuracy. A 24-hour data lag in a fraud detection workflow is the difference between catching an anomaly and writing off a loss. Embedded real-time analytics with sub-60-second refresh is a legitimate competitive moat in fintech.
Healthcare
Healthcare applications face a unique combination of regulatory complexity and operational urgency. Purpose-built healthcare analytics software must give patient outcomes, appointment utilization, billing performance, and resource allocation full visibility while complying with HIPAA, GDPR, and increasingly complex state-level privacy regulations.
Key use cases: Patient outcome tracking by provider and care pathway, appointment utilization and no-show pattern analysis, claim denial root cause analysis, resource utilization dashboards for hospital operations, population health trend monitoring, provider performance benchmarking.
The non-negotiable in this vertical: Multi-tenant security with audit logging. Row-level security that enforces patient data separation is a legal requirement, not a preference. Embedded analytics platforms that carry HIPAA-compliant architecture reduce the compliance burden on the product team significantly.
Logistics and Supply Chain
Operational intelligence is the entire value proposition in logistics analytics. The window to act on a delivery exception is measured in hours. A delayed alert is a missed SLA, a customer escalation, and a service credit, which is why purpose-built supply chain analytics software needs to surface exceptions before they become incidents.
Key use cases: Live shipment tracking dashboards embedded in the dispatcher console, carrier performance scorecards updated in real time, warehouse utilization and capacity forecasting, on-time delivery trend analysis, exception management dashboards for high-value freight, cost-per-shipment analytics by carrier and route.
The critical feature in this vertical: Real-time streaming analytics. Logistics doesn't work with hourly batch refreshes. The embedded analytics layer must connect to live event streams and surface exceptions as they occur not when the next ETL job runs.
HR and People Analytics
HR analytics has become a board-level function. Attrition risk, diversity progress, talent pipeline health, and compensation equity are no longer nice to have reporting they're questions the C-suite and board ask every quarter. HR platforms that embed analytics transform from system of record to system of insight. That's the product positioning shift that justifies premium pricing.
Key use cases: Attrition risk scoring with driver analysis embedded in manager dashboards, time-to-hire trend analysis by department and role, diversity and inclusion metrics with peer benchmarking, compensation equity analysis, employee engagement trend correlation with attrition, succession planning readiness dashboards.
E-Commerce and Retail
Merchants need to make fast decisions about inventory, pricing, marketing spend, and customer retention usually without a data science team on staff. Retail analytics embedded in commerce platforms replaces the export to Excel and figure it out workflow with real-time, role-specific dashboards inside the platform they run their business on.
Key use cases: Real-time sales dashboards by SKU, channel, and geography, customer cohort analysis and lifetime value modeling, inventory velocity and stockout risk forecasting, marketing attribution by channel and campaign, return rate analysis with reason categorization, pricing elasticity insights embedded in product management views.
Embedded Analytics for SaaS Companies
SaaS companies have requirements that make embedded analytics both more critical and more technically demanding than almost any other use case. Let's be specific about why.
Multi-tenancy at scale is a hard problem.
When you have 500 customers and you're trying to get to 5,000 each tenant must see exactly their own data. Not approximately. Exactly. A data leak between tenants is not a bug. It's a security incident, a potential breach of your customer contracts, and potentially a GDPR violation.
Building multi-tenancy correctly from scratch requires implementing row-level security, tenant isolation, authentication flows, and access control at the query level. Getting this right takes a capable engineering team 6-12 months. Getting it wrong takes considerably less time.
Databrain handles multi-tenancy programmatically via guest tokens. You provision a new tenant in a single API call. The platform enforces isolation at the query level automatically. Zero per-tenant configuration. Zero risk of cross-tenant data leakage from misconfiguration.
White-labeling is a product requirement, not a styling preference.
When your customers open your product, they should see your brand. Not "Powered by [vendor]". Not a foreign UI component that looks like it was stitched in from another application.
Full white-labeling means: your colors, your typography, your logo, your component patterns. The analytics experience should be indistinguishable from the rest of your product. Anything less creates a perception of lower product quality and customers notice.
SaaS pricing economics require flat-rate analytics costs.
Per-viewer or per-user fees are a growth tax. When your customer base doubles, your analytics costs should not double. That's a unit economics problem that compounds and eventually forces either a price increase (customer friction) or a margin problem (operational friction).
DataBrain's Flat-rate pricing models with unlimited end-user viewers mean your analytics costs are predictable regardless of scale. Whether you have 200 customers or 20,000, the cost line doesn't move based on viewer count.
Implementation speed is a revenue decision, not just a technical one.
Every quarter you wait to ship analytics features is a quarter of sales cycles where a competitor demos something you don't have. The engineering effort required to build analytics in-house 12-18 months for most teams is not just a cost. It's a competitive delay. Databrain closes that gap to 2-4 weeks.
What SaaS companies must require from an embedded analytics :
- Guest token-based multi-tenant embedded analytics with programmatic tenant provisioning
- Native React SDK components (not just iFrame embedding)
- Full white-label control colors, typography, logos, layouts
- Direct connectivity to modern data warehouses (Snowflake, BigQuery, PostgreSQL)
- Flat-rate pricing that doesn't penalize growth
- AI features designed for business users, not just analysts
- SOC 2 Type II and GDPR compliance
Key Features to Evaluate in Embedded Analytics
Every embedded analytics vendor claims to have the right feature set. Here's what separates purpose-built embedded analytics from BI tools with bolted-on embedding capabilities.
.png)
Multi-Tenancy and Row-Level Security
The non-negotiable for SaaS. Ask every vendor three specific questions: How do you model tenants? How do you enforce isolation at the query level, the row level, or the schema level? How do you manage per-tenant configuration at scale when you have 1,000+ tenants?
If the answer involves manually creating a workspace or configuration record for each new customer, that's an operational overhead that doesn't scale.
White-Labeling and Customization
Full control over branding, layout, and interaction patterns. This means: your brand colors, your fonts, your logo, your component styling. Configurable layouts that match your existing UI patterns. The ability to hide all vendor branding completely.
Partial white-labeling where you can change a logo but not the overall visual language creates a perceptible product quality gap that users notice, even if they can't articulate exactly why.
Developer Experience and Integration Quality
Your engineers will own the integration and maintain it over time. Poor SDK documentation, unclear authentication patterns, or an iFrame-only embedding option creates a maintenance burden that compounds with every product iteration.
Look for: well-documented REST APIs and SDKs, React components for front-end integration, direct backend integration with your data warehouse, clear authentication and token management patterns, and responsive technical support from the vendor's engineering team.
Real-Time and Near-Real-Time Data
Be precise about your latency requirements before you evaluate platforms. Sub-second updates are necessary for operational monitoring use cases (live dashboards, anomaly detection). Near-real-time refresh cycles work for most SaaS customer-facing dashboards. Hourly or daily batch refreshes are only acceptable for historical trend reporting.
Confirm that the platform can selectively configure refresh intervals by metric or dashboard, and that real-time connectivity doesn't require a separate data pipeline.
Security and Compliance
Minimum requirements: SOC 2 Type II, TLS encryption in transit, AES-256 at rest, comprehensive audit logging, and data residency options for customers with GDPR or CCPA obligations. ISO 27001 is increasingly expected by enterprise customers. For teams managing access across multiple roles and tenants, role-based data governance in embedded analytics is where most implementation gaps surface.
For healthcare customers: HIPAA-compliant architecture is a gating requirement. Authentication patterns matter just as much as encryption — secure SSO and OAuth for embedded dashboards covers the specific implementation requirements enterprise customers will ask about in security reviews. For a full overview of how Databrain handles compliance across SOC 2, GDPR, HIPAA, and ISO 27001, see the Databrain security overview
Visualization Breadth and Interactivity
Line, bar, scatter, heatmap, funnel, cohort, map, time series, and custom chart types are the baseline for any serious embedded data visualization layer. Beyond chart types, evaluate: drill-down capabilities, cross-filtering across charts, brushing and selection patterns, responsive layouts for different screen sizes, and export options for customers who still need PDF or CSV output.
AI and Natural Language Query
In 2026, the meaningful differentiation between platforms includes the quality of their AI layer. Natural language query interfaces, AI-generated insights and anomaly alerts, and predictive features designed for business users not just data analysts are now features that customers evaluate and talk about in demos.
Integration Methods: iFrame vs SDK vs API
How you embed analytics into your product has real consequences for UX quality, long-term maintainability, and the depth of integration you can achieve. This is a technical decision with product-level implications.
iFrame Embedding
An iFrame loads a separate web page inside a frame within your application. It's the lowest-effort starting point, minimal code changes, works with any front-end framework, quick to prototype.
The tradeoffs are significant. iFrames constrain visual styling the embedded component sits inside a box, and cross-origin communication limits what you can do with it. The analytics experience feels bolted on rather than native. For internal dashboards or quick internal tooling, iFrames are often good enough. For customer-facing embedded analytics that need to feel premium, they're not.
Best fit: Internal dashboards, rapid prototyping, simple report embedding where deep integration isn't required.
React SDK
Native SDK components integrate analytics directly into your application's DOM. Charts and dashboards render as first-class components in your front-end framework styled with your design system, behaving like any other component in your codebase.
This is the gold standard for customer-facing embedded analytics. Setup takes more time than iFrame embedding, but the UX quality difference is immediately visible. End users interact with analytics that feel like it was built by your team for your product.
Databrain's SDK integrates directly into your application through native React components. You control styling, interaction patterns, and layout just like any other component in your product creating a seamless user experience without relying on iframe-based embedding. See the step-by-step guide to create a React dashboard or follow the Next.js customer-facing analytics setup if your stack runs on Next.js.
Best fit: Customer-facing SaaS analytics, premium product experiences, deeply integrated dashboards that must match your product's visual language.
API-First Integration
You fetch data and metadata via APIs, then render it using your own front-end components. Maximum flexibility. Highest engineering investment. You own the entire rendering layer, which means you can build truly custom visualization experiences but you also own the maintenance burden of everything you build. Teams working outside the React ecosystem can follow the same approach with our guide to create a dashboard in Angular or create a Python dashboard for backend-driven rendering use cases.
Best fit: Highly custom analytics experiences, organizations with dedicated analytics engineering teams, cases where standard visualizations genuinely don't fit the use case.
The decision rule:
If you're building customer-facing analytics for a SaaS product and you care about UX quality and long-term maintainability use an SDK. The implementation time difference between iFrame and SDK is measured in days. The product quality difference is visible in every demo.
Build vs Buy: Making the Right Choice
This is the most consequential decision in your embedded analytics journey. Most teams get it wrong in the same direction they overestimate their ability to build it faster and cheaper than the vendors.
Let's be direct about economics.
The Real Cost of Building In-House
Building a production-ready embedded analytics system requires: a query engine that can handle complex aggregations at scale, a multi-tenant architecture with row-level security, a white-label embedded analytics layer, authentication and token management, governance and audit logging, performance optimization at scale, and ongoing maintenance as your data model evolves.
Doing this correctly not as a prototype, but as a production system you'd stake enterprise deals on takes 12-18 months for a capable team. That's the consistent reported timeline from teams that have done it.
Most internal analytics projects also deal with: shifting internal priorities mid-build, under-scoped security requirements discovered late, data model changes that require rearchitecting work in progress, and the fundamental challenge that analytics UX is its own product discipline.
The Hidden Cost Nobody Talks About
Every sprint your team spends on analytics infrastructure is a sprint not spent on your core product differentiators. The opportunity cost of 12-18 months of engineering time isn't just the cost of the engineers. It's the competitive advantage you didn't build, the features your customers asked for that stayed on the backlog, and the enterprise deals you lost because your product was missing capabilities that a purpose-built platform could have delivered in two weeks.
When Buying Makes Sense (Most Cases)
Databrain gets you to production in 2-4 weeks. They handle multi-tenancy, security, governance, scaling, and a continuously improving feature roadmap including AI capabilities that would require a dedicated ML team to build in-house.
When Building Makes Sense (Rare Cases)
Build makes sense when analytics itself is your product when the analytics experience is your primary market differentiator and you have both the capital and the specialized expertise to treat it as a product line with a dedicated team. For most SaaS companies, analytics is a feature of their product. Not the product itself. For that category which is the vast majority of SaaS buying is the correct default.
Ask yourself this: if you could ship analytics in two weeks by buying a platform, what would your engineering team build with the 16 months they'd otherwise spend building it? Usually that answer resolves the build vs buy question immediately.
Embedded Analytics Pricing: What to Expect at Every Stage
Pricing in this space is genuinely confusing because vendors use completely different models. Here's a clear map so you can compare apples to apples.
Flat-Rate / Unlimited Viewer Pricing
Databrain charges a flat monthly rate $999-$1,995/month with unlimited end-user viewers. You pay for platform access, not for how many of your customers use it. This is the most SaaS-friendly model: as your customer base grows, your analytics cost stays fixed.
This model works particularly well for companies with large customer bases where per-viewer fees would compound quickly.
Per-Workspace / Per-Tenant Pricing
Some enterprise-focused platforms (like GoodData) charge a platform fee plus a per-workspace fee per tenant typically $20–$30 per workspace/month. At 50 tenants, this is manageable. At 5,000 tenants, it becomes a major cost line that scales with your growth.
Per-User / Per-Viewer Licensing
Tableau, Power BI, Looker, and ThoughtSpot charge per active user or viewer. For internal analytics with a fixed team, this is predictable. For customer-facing SaaS analytics where you're embedding for thousands of end users across hundreds of customers, per-viewer fees can escalate into six figures per year quickly.
Capacity-Based Pricing
Power BI Embedded charges by Azure capacity unit (A-SKU or P-SKU), not by user. A1 SKU starts around $735/month; production-grade P1 SKUs start around $5,000/month. The model can work at specific scale points but requires careful capacity planning and Azure ecosystem commitment.
Open-Source
Metabase and Apache Superset are free to license. Infrastructure, DevOps operations, multi-tenant security engineering, and white-label development are not free. For internal analytics, open-source tools are often of excellent value. For production-grade multi-tenant customer-facing analytics, the total cost of operating them at scale usually exceeds purpose-built platform licensing.
Three-Year TCO: The Only Number That Matters
When evaluating cost, build a 3-year total cost of ownership model that includes: licensing, implementation time (your engineering team's hours), infrastructure costs, ongoing maintenance, and the opportunity cost of delayed shipping. Purpose-built platforms almost always win on 3-year TCO for SaaS companies shipping customer-facing analytics.
The Role of AI in Embedded Analytics
AI embedded analytics has moved past the demo stage. In 2026, it's in production at companies that treated it as a product decision, not an infrastructure experiment. Understanding the AI framework for analytics that separates successful deployments from failed experiments is where most teams should start.
Layer 1: Natural Language Access
Users ask questions in plain English. The AI layer translates those questions into the right metrics, applies the appropriate filters, and returns an answer with no SQL knowledge required, no dashboard navigation required.
"Which of my customers have been growing but haven't upgraded their plan in the last six months?" Returns a ranked list, automatically filtered, with the top upgrade opportunities highlighted. The business user gets the answer in under 10 seconds. The same query would have taken an analyst 20–30 minutes to build in a traditional BI environment.
The accuracy breakthrough that made this production-ready: semantic layers. When NLQ for analytics is guided by a centralized layer of business logic and metric definitions, accuracy improves dramatically. Without a semantic layer, natural language analytics produces impressive demos and unreliable production results. With one, the same underlying model becomes genuinely useful.
Layer 2: Predictive Intelligence
Rules-based alerts tell you something happened. Predictive models tell you something is about to happen with enough lead time to act on it.
Churn risk scores updated in real time and embedded in the CS console. Anomaly detection that surfaces an unusual drop in feature usage before a customer disengages. Revenue forecasting that accounts for seasonal patterns and pipeline composition. Capacity forecasting that predicts when infrastructure will need to scale.
These aren't future capabilities. They're in production at companies that made the investment. The barrier to entry has dropped significantly as ML infrastructure has matured and as purpose-built platforms have started including predictive features in their standard offering. See the full breakdown of what AI analytics looks like in production across each of these use cases.
Layer 3: Prescriptive Recommendations
This is where AI moves from informing to guiding. Not just "here's what's happening" but "here's what to do about it, based on what worked with similar customers."
Next-best-action recommendations for sales reps embedded directly in the CRM workflow. Suggested customer success playbooks triggered automatically when a health score drops below threshold. Prioritized intervention lists for support teams. Content recommendations for product managers based on feature adoption patterns.
The pattern that separates successful AI implementation from failed experiments: AI works when it's embedded where decisions happen. An AI insight living in a separate "analytics" tab that nobody checks produces zero ROI. The same insight appearing in the workflow one click from the action it recommends produces measurable results.
Implementation Reality: Stage It
You don't need deep learning models to get meaningful value from AI-powered embedded analytics. Most teams succeed by shipping in stages:
Rules-based alerts first (2-4 weeks): define thresholds, trigger notifications in workflow. Basic predictive models next (2-3 months): churn scoring, usage forecasting with interpretable models. Natural language and generative AI later: after the data foundation is solid and the semantic layer is defined. Advanced models only when simpler approaches plateau.
One thing worth understanding before you scale: the limitations of LLMs in BI are real and knowing them upfront prevents the most common implementation mistakes.

How to Monetize Embedded Analytics
Your embedded analytics investment should generate revenue, not just operational value. Here are the three monetization paths that consistently work. For a deeper breakdown of each with real pricing examples, see how to monetize embedded analytics
Tiered Product Packaging
The most reliable path for most SaaS companies. Structure your pricing so analytics capabilities escalate across tiers:
Core plan: basic pre-built dashboards, standard KPIs, limited date ranges. Professional plan: advanced filtering and drill-down, custom date ranges, some predictive insights, scheduled reports. Enterprise plan: full self-service exploration, natural language query, API access, custom dashboards, benchmarking features, audit logging.
This structure works because it makes the value of upgrading immediately visible. Customers on the Core plan see what they're missing every time they hit a feature gate. The analytics tier becomes the natural upgrade conversation.
Usage-Based and Add-On Packaging
If your core product doesn't naturally stratify across analytics-heavy tiers, position analytics as a discrete add-on module. "Revenue Insights," "Operations Intelligence," or "Customer Analytics" as a named feature set with a clear price point.
This works particularly well when your analytics capability is genuinely differentiated when it provides value that customers couldn't easily replicate with a standalone BI tool. The value justifies the add-on fee, and the convenience of having it embedded (vs. managing a separate tool) reinforces that justification.
Data-as-a-Service and Benchmarking
At scale when you have enough customers across enough segments your aggregated, anonymized data becomes a product in itself. Industry benchmarks, peer performance comparisons, "State of X" reports with real data from your customer base. Customers pay a premium for context they can't get anywhere else.
This only works at genuine scale (typically 500+ customers in a reasonably homogeneous segment) and requires careful data governance and customer consent frameworks. But for companies that can do it, it's a differentiated revenue stream that also strengthens retention customers stay because leaving means losing access to their benchmark comparisons.
Where Embedded Analytics Is Headed ?
Embedded analytics is rapidly evolving from simple in-product dashboards to systems that actively influence business decisions and workflows. Instead of only showing what happened, modern analytics is moving toward agentic capabilities, where AI systems continuously monitor data, detect anomalies or opportunities, and recommend or trigger actions automatically.
At the same time, the combination of semantic layers and generative AI is making natural language analytics far more accurate by grounding AI-generated queries in structured business logic and metric definitions. Another major shift is the move toward real-time analytics, as companies increasingly expect insights from data in motion rather than relying on batch updates. Architecturally, many organizations are adopting composable analytics stacks, assembling modular components for data modeling, visualization, governance, and AI instead of relying on monolithic BI platforms.
Together, these changes reflect a broader reality for SaaS companies: customer-facing analytics is no longer a differentiator but an expectation, and the real competitive advantage now comes from delivering analytics that are intelligent, real-time, deeply integrated into product workflows, and capable of driving action rather than just reporting data. Read our embedded analytics trends for 2026 for a deep dive.
Embedded Analytics Tools: Where to Start
The embedded analytics market has three vendor categories, each with meaningfully different multi-tenancy models, white-labeling capabilities, and pricing structures.
Purpose-Built for SaaS Embedding (DataBrain, GoodData, ThoughtSpot): Designed from the ground up for multi-tenancy, white-labeling, and customer-facing analytics. Fastest time-to-market. Best fit for most product teams embedding analytics.
Enterprise BI with Embedding Capabilities (Tableau, Power BI, Looker, Sisense): Primarily internal analytics tools that added embedding as a secondary use case. Strong visualization quality. Multi-tenancy and white-labeling are functional but not native.
Open-Source and Self-Hosted (Metabase, Apache Superset): Free licensing with significant DevOps requirements. Best for internal analytics. Not designed for production multi-tenant customer-facing use cases at scale. For a deeper look at self-hosted options, see our guide to self-hosted embedded analytics.
DataBrain's embedded analytics platform: Native React SDK (see our React dashboard tutorial). Guest-token-based multi-tenancy. Full white-labeling. Direct Snowflake, BigQuery, and PostgreSQL connectivity. Flat-rate pricing at $999–$1,995/month with unlimited viewers. Typical time to production: 2–5 days.
For a detailed comparison of all platforms with pricing, features, and developer experience, read our full embedded analytics tools comparison.
How to Get Started with Embedded Analytics
The most common mistake teams make at this stage: trying to build "all analytics for everyone" in phase one. Don't. Start with three to five high-value use cases, ship them well, and prove ROI before expanding.
Before you write a single line of code, answer these five questions:
- What are the 3-5 decisions you most want to improve with analytics? Be specific not "better reporting" but "help CSMs identify at-risk accounts 30 days before renewal."
- Is your data clean, connected, and consistently defined? If "active user" means different things in different parts of your database, analytics will surface those inconsistencies. Fix the definitions first.
- Build or buy: be honest about your team's capacity and your actual timeline. When do you need analytics in production? What does your team have bandwidth to build and maintain?
- Which customer persona benefits most from analytics first? Start with the persona where analytics creates the most visible, immediate value. Ship there first. Learn. Expand.
- How will you measure adoption and ROI from analytics features? Define success metrics before you launch feature adoption rate, time-to-insight reduction, NPS delta, churn rate differential between analytics users and non-users.
Phase 1: Embedded Analytics Implementation Design (2-4 weeks)
Audit your data sources. Map your core entities: users, accounts, events, transactions. Build your metrics dictionary and define every key business metric in writing before implementation. This prevents the downstream arguments about whether a number is correct.
Select your platform. If you're a SaaS company without dedicated analytics engineering, Databrain is almost always the correct answer. Schedule a proof-of-concept with your actual data, not sample data from the vendor's demo environment.
Phase 2: Integration (4-8 weeks)
Connect data sources to the analytics platform. Build initial dashboards for your phase-one use cases. Implement authentication (guest tokens or SSO). Embed the first dashboard into your product via SDK components.
Test with internal users first. Then expand to a cohort of friendly external customers who've asked for analytics. Collect feedback aggressively the first version will have UX gaps, and real users will find them faster than your team will.
Phase 3: Rollout (2-4 weeks)
Pilot publicly with a defined customer segment. Instrument everything which dashboards are being opened, which filters are being used, how long users spend in analytics sections. Use that data to prioritize the phase-two roadmap.
Launch broadly. Set up automated feedback collection. Start the conversation about analytics as a pricing lever if you haven't already pilot pricing with a cohort of customers who are already using the analytics features heavily.
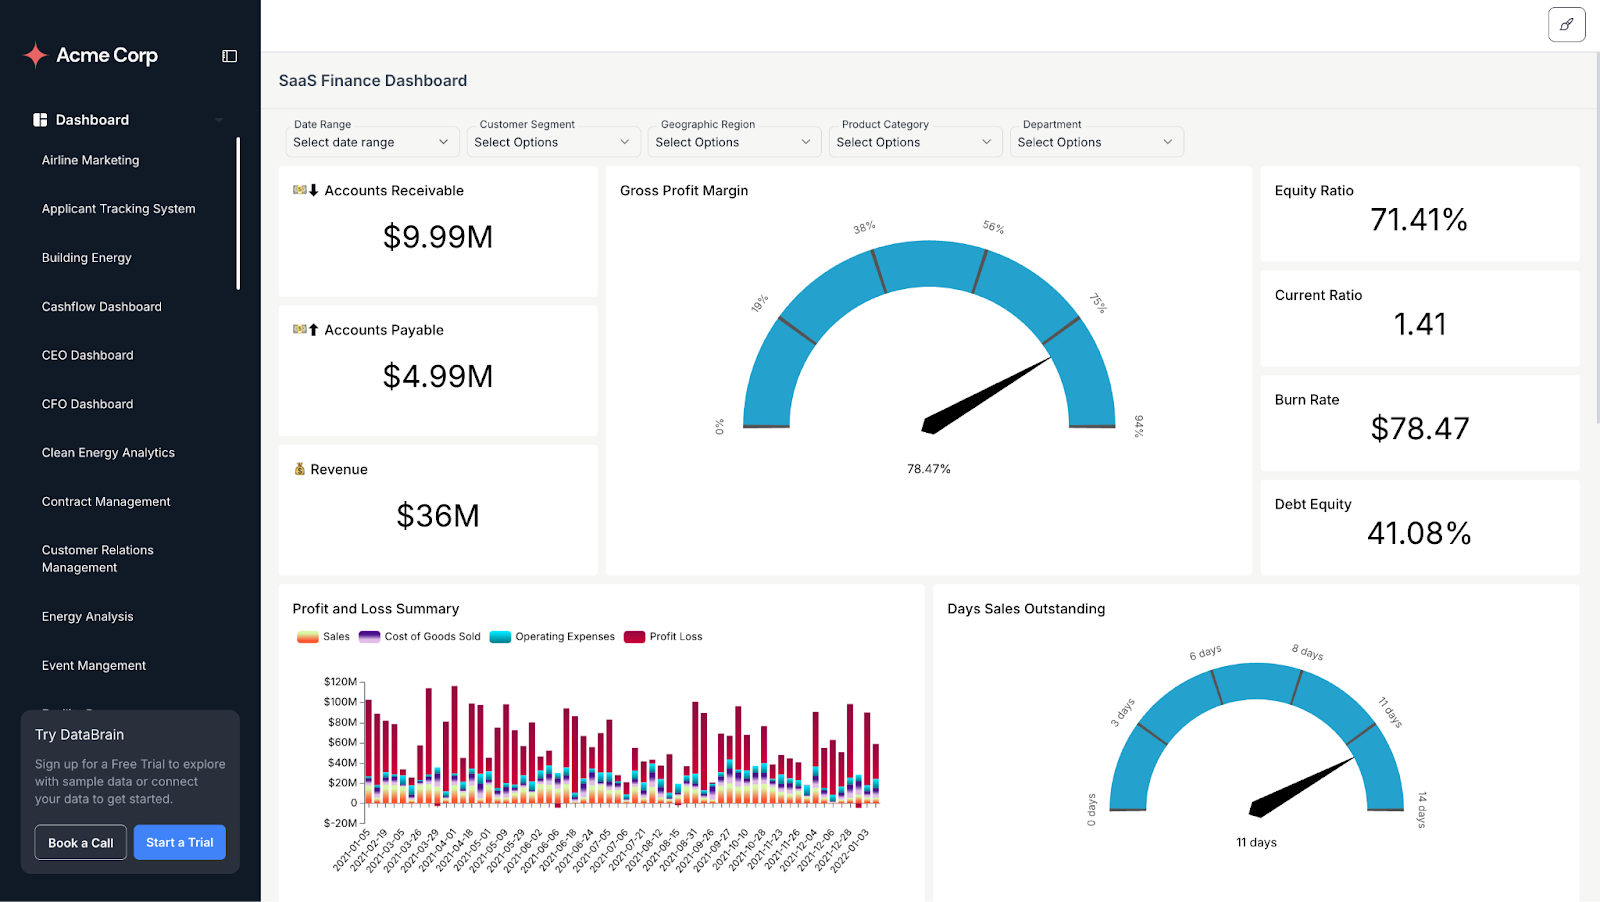
See It Live: SaaS Finance Dashboard
The dashboard below is a working example of what your customers experience when analytics are embedded natively inside your product. Built on Databrain, this SaaS Finance view surfaces ARR growth, MRR breakdown, net revenue retention, and account-level health, inside a single interface.
Explore the interactive SaaS Finance dashboard
No login required. Drill into any chart, filter by date range, and see how Databrain's native React SDK renders analytics that feel indistinguishable from the rest of your product.
Get Started Today
Embedded analytics is no longer a "later" item. It's a now item and for a significant percentage of SaaS companies, it's already a "we're behind" item.
The companies that close the gap fastest in 2026 will be those that stop treating analytics as an infrastructure project and start treating it as a product decision. Who are your users? What decisions do they need to make? What does the right insight, in the right place, at the right time look like for them?
Answer those questions, pick a purpose-built platform that removes the infrastructure burden, and ship in weeks instead of years.
Databrain is built specifically for SaaS companies that need to ship embedded analytics without sacrificing 18 months of engineering time. Native React SDK. Guest-token multi-tenancy. Full white-labeling. Direct warehouse connectivity. Flat-rate pricing that doesn't punish growth.
Start with DataBrain | Read the developer documentation | Book a demo
Frequently Asked Questions
How does embedded analytics work?
Embedded analytics works by connecting your application to a data source (database, data warehouse, or event stream), applying a security and multi-tenancy layer that ensures each user sees only their own data, and rendering visualizations: charts, KPI cards, tables, funnels directly inside your application UI via an SDK component, API, or iFrame.The key components are: data connectivity (direct warehouse or database connection), a semantic or metric layer that translates raw data into business concepts ("daily active users" instead of "SELECT COUNT(DISTINCT user_id) WHERE..."), multi-tenant security enforced at the query level, and a rendering layer (typically a JavaScript or React SDK for production use cases). The result is analytics that appear native to your product indistinguishable from features your team built rather than embedded from an external tool. Deep dive on Embedded Analytics Architecture and Data Marts.
What is the difference between embedded analytics and traditional BI?
Traditional BI (Tableau, Power BI, Looker) is a separate tool that your analysts open, build dashboards in, and share with others. Users need a separate login, a different URL, and typically some training to use it effectively. The insight lives in BI; the action happens in a different tool. That gap between insight and action is where decision latency comes from.Embedded analytics puts the dashboards inside the product your users already use. No extra login. No context switch. No separate tool to learn. The insight and the action happen in the same place.The business difference: traditional BI is a cost center for your organization. Embedded analytics is a product feature one that drives retention, justifies premium pricing, and creates competitive differentiation. They solve different problems for different audiences.
How much does embedded analytics cost?
Costs vary significantly based on vendor type and architecture. Databrain uses flat-rate pricing $999-$1,995/month with unlimited end-user viewers which stays predictable as your customer base grows. Enterprise BI platforms (Tableau, Power BI, Looker) use per-user or per-viewer licensing, which scales linearly with the number of end users and can reach six figures annually for SaaS companies with thousands of customers. Open-source tools (Metabase, Apache Superset) are free to license but require significant engineering investment to run in production with proper multi-tenancy and white-labeling.For SaaS companies, the correct cost comparison is not "platform licensing vs free open-source". Its "platform licensing vs the full cost of building equivalent capabilities in-house" typically $500,000 to $1,500,000 in engineering time over 12-18 months, plus ongoing maintenance. Against that comparison, purpose-built platform pricing is almost always the lower-cost path.
Should I build or buy embedded analytics?
For most SaaS companies, buy. The honest breakdown: building a production-ready embedded analytics system takes 12-18 months and typically costs $500,000 to $1,500,000 in engineering time, plus ongoing maintenance. Buying a purpose-built platform gets you to production in 2-4 weeks at $1,000-$3,000/month.Build is justified only when analytics is your primary product when the analytics experience itself is what you're selling, and you have the capital, the specialized expertise, and the organizational commitment to treat it as a dedicated product line. For most SaaS companies, analytics is a feature of their product, not the product itself. For that category, buying is the correct default.The question to ask yourself: if you could ship analytics in two to four weeks by buying a platform, what would your engineering team build with the 16 months they'd otherwise spend on it? That answer usually resolves the decision.
What are the challenges of embedded analytics?
The main challenges are multi-tenant data isolation at scale, where every customer must see exactly their own data with zero leakage between tenants. Building this correctly from scratch requires row-level security, tenant-aware query execution, and authentication flows that typically take 6-12 months of engineering effort. Other challenges include achieving full white-label UX parity so the analytics feel native to your product rather than bolted on, maintaining query performance under hundreds of concurrent users, handling schema migrations without breaking existing dashboards, and managing the ongoing maintenance burden as your data model evolves. Databrain handles these challenges out of the box.


