Looker Alternatives 2026: 8 Best Embedded Analytics Tools
Searching for the best Looker Embedded Analytics Alternatives in 2026? Explore our list of 9 options including DataBrain, Sisense, Tableau, and more to find the best for your business.


Key Takeaways
- The best Looker alternatives in 2026 are DataBrain, Sisense, and Luzmo for native SaaS embedding; Power BI Embedded, Tableau, and Metabase for cloud and open-source BI; and ThoughtSpot and GoodData.AI for AI-first, semantic-layer analytics. Teams leave Looker mainly for lower and more predictable cost, faster time-to-value than a full LookML build, native (non-iframe) embedding, and cloud-agnostic data access.
- Looker pricing is quote-based: a platform fee plus per-user licenses. Google publishes no list price; the most-cited 2026 anchor is Vendr's procurement average of ~$150k/year across 355 deals. Independent analyses put the Standard platform fee around $60k/year (smaller deployments nearer ~$36k–$60k), with marketplace-listed per-user add-ons roughly $400/viewer, $799/standard, and $1,665/developer per year — so a 50–100-user deployment commonly lands at ~$80k–$150k+/year before BigQuery and implementation, and embedded-heavy deployments rise into the six figures.
- The right alternative depends on which Looker wall you hit. Per-seat cost scaling against your customer viewers → flat-rate or per-workspace (DataBrain, GoodData.AI). LookML modeling overhead or slow time-to-value → embedded-native (DataBrain, Sisense, Luzmo). GCP/BigQuery lock-in → a cloud-agnostic embed. Iframe/white-label limits → a native-component embed.
- DataBrain's own pricing page lists the Pro plan as a "Looker replacement." Flat-rate models (DataBrain), capacity (Power BI), open-source (Metabase), and per-workspace (GoodData.AI) each trade a different floor for a clearer ceiling than per-seat licensing that scales with adoption.
- 2026 is the agentic year — and Looker shipped for it. Gemini in Looker and Conversational Analytics are GA, and Looker's MCP server is in preview (Google Cloud Next '26). Evaluate alternatives on MCP support and semantic-layer-grounded AI accuracy, not demo polish — the freshness section below maps every vendor's GA-vs-preview AI status.
Looker is one of the most respected platforms in business intelligence, and for good reason: its LookML semantic layer turns business logic into governed, versioned, reusable metric definitions, and its Google Cloud roots make it a natural fit for BigQuery-centric data teams. But the same things that make Looker powerful for an internal analytics team (model-first LookML, platform-fee-plus-per-seat pricing, and iframe-based signed embedding) are exactly why SaaS product teams building customer-facing analytics often shortlist alternatives.
This guide compares the 8 most credible Looker alternatives in 2026, grouped by what each tool does best, not ranked one to eight. If you're new to the category, start with the fundamentals of embedded analytics before comparing feature sets.
Looker vs Looker Studio (read this first): This page is about Looker, the Google Cloud BI platform built on LookML that SaaS teams embed in their products. It is not about Looker Studio (the free, formerly Google Data Studio dashboarding tool). They share a brand and almost nothing else; if you came here for the free tool, the embedding-grade alternatives below still apply, but the pricing context will not.
At a Glance
Tool Best for Embedding model Pricing model 2026 AI capability
Pricing is summarized; see each vendor's section and the linked pricing breakdowns for current figures and "as of" dates. DataBrain's own rates are on the pricing page.
Why Look for Looker Alternatives in 2026?
Looker is a genuinely strong platform for a governed, GCP-centric internal analytics practice: LookML is the gold standard for a versioned semantic layer, and BigQuery integration is seamless. The triggers below are the recurring reasons SaaS product teams still shortlist alternatives, especially for customer-facing analytics where the embed has to feel like part of your product and the bill has to survive your own growth.
- Platform-fee-plus-per-seat cost that scales against you. Looker pricing is quote-based, but independent 2026 analyses converge on a Standard platform around $60k/year plus per-user licenses (marketplace-listed add-ons near $400/viewer, $799/standard, $1,665/developer per year). When your "users" are your customers, those seats multiply fast. Embedded deployments commonly run into the six figures, and Vendr's data across 355 deals shows an average around $150k/year. A per-seat model penalizes the exact thing you want (more customers using analytics).
- LookML modeling overhead and specialist dependency. LookML is powerful but proprietary and skill-intensive. You model first and visualize later (there's no shortcut), and most product teams don't have analytics engineers fluent in LookML in-house. That creates a dependency on a small specialist group and adds to total cost of ownership beyond license fees.
- Iframe embedding and white-label limits. Looker's embedded analytics is iframe-based, secured with signed URLs (the embed secret must be protected "as if it were admin credentials") and SSO. It works, but embedded dashboards carry Looker branding by default, deep white-labeling and native UX integration are harder than with a front-end SDK, and the richest embed capabilities sit in the higher-priced Embed/Elite edition.
- Google Cloud / BigQuery gravity. Looker is warehouse-first and most at home on GCP and BigQuery. For SaaS products that aren't all-in on Google Cloud (or whose customers require data residency or sources outside BigQuery), that ecosystem gravity is a real constraint, and many teams want cloud-agnostic connectivity.
- Time-to-value for embedding. Because Looker is model-first, a full semantic layer with governed metrics, multi-tenant security, and production embedded dashboards commonly takes months for teams new to LookML. SaaS product teams iterating on a customer-facing feature usually want to ship in weeks.
A sixth axis is new for 2026: the agentic shift. Looker itself shipped Gemini in Looker and Conversational Analytics to GA and put an MCP server in preview, which raises the bar for every alternative on conversational and agentic capabilities, covered in the freshness section below.
If your specific reason isn't on this list, the rest of this guide still helps, but weight the alternative selection toward whichever pain point dominates for you.
How Looker's LookML Semantic Layer Shapes the Decision
Three architectural contrasts dominate the engineering conversation when teams evaluate Looker against embedded-native alternatives. Each is a real design decision, not a feature-matrix bullet.
1. Semantic layer: LookML model-first vs lighter / warehouse-side models. Looker's defining strength is LookML: you define metrics, dimensions, joins, and access rules once, in code, and everything inherits them. For multi-tenant embedding, row-level isolation is enforced with an access_filter keyed on a user attribute:
view: orders {
measure: total_revenue {
type: sum
sql: ${TABLE}.amount ;;
value_format_name: usd
}
dimension: tenant_id {
sql: ${TABLE}.tenant_id ;;
}
}

explore: orders {
# each embedded user only sees their tenant's rows
access_filter: { field: orders.tenant_id user_attribute: tenant_id }
}
This is governed and consistent, but it's the up-front investment teams underestimate. Embedded-native and open-source alternatives either ship a lighter built-in semantic model or push metric logic to the warehouse, trading some governance ceremony for faster time-to-first-dashboard. GoodData.AI is the closest "keep the governed semantic layer, drop the GCP coupling" option; DataBrain and Luzmo favor speed.
2. Embedding: iframe + signed URL vs native component. Looker embedding is a signed, iframe-based flow: your backend signs a URL with the embed secret and the user's attributes (including the tenant_id that drives the access_filter above), and the frontend renders it inside an iframe:
// Representative Looker signed-embed flow (backend signs, frontend iframes)
const src = createSignedEmbedUrl({
host: "yourco.cloud.looker.com",
secret: LOOKER_EMBED_SECRET, // protect like admin credentials
user: { external_user_id: "u_123", user_attributes: { tenant_id: "acme" } },
embed_url: "/embed/dashboards/42",
});
// <iframe src={src} /> is DOM-isolated from your app's styles
Embedded-native alternatives render charts as a component in your page's own DOM instead. DataBrain, for example, ships a single Shadow-DOM web component that renders the same way across React, Angular, Vue, and vanilla hosts, with an opaque per-session token minted server-side:
<!-- One component, every host framework, no iframe --><dbn-dashboard token="OPAQUE_SERVER_TOKEN" dashboard-id="42"></dbn-dashboard>The engineering call: Looker's signed-iframe model is secure and mature, but the embed is DOM-isolated, so your app's styles can't reach into it and deep white-labeling needs the Embed edition. Component-level embedding gives you native styling and interaction control for similar setup effort.
3. Cost shape: platform fee + per-seat vs flat / capacity / per-workspace. Looker's economics combine a platform fee with per-user licensing, which rewards a fixed internal analyst team but punishes success when your "users" are customers. Alternatives that price flat-rate per environment (DataBrain), on reserved capacity (Power BI), open-source per-instance (Metabase), or per-workspace (GoodData.AI) give you a clearer monthly ceiling. Map your real viewer-growth curve before assuming one model is cheaper: per-seat looks fine at 20 internal users and painful at 2,000 customer viewers.
The 8 Best Looker Alternatives (2026)
Grouped by category. Within Embedded-Native, DataBrain is listed first with honest framing of where it wins and where it doesn't. It is one option in the category, not a default pick.
Embedded-Native
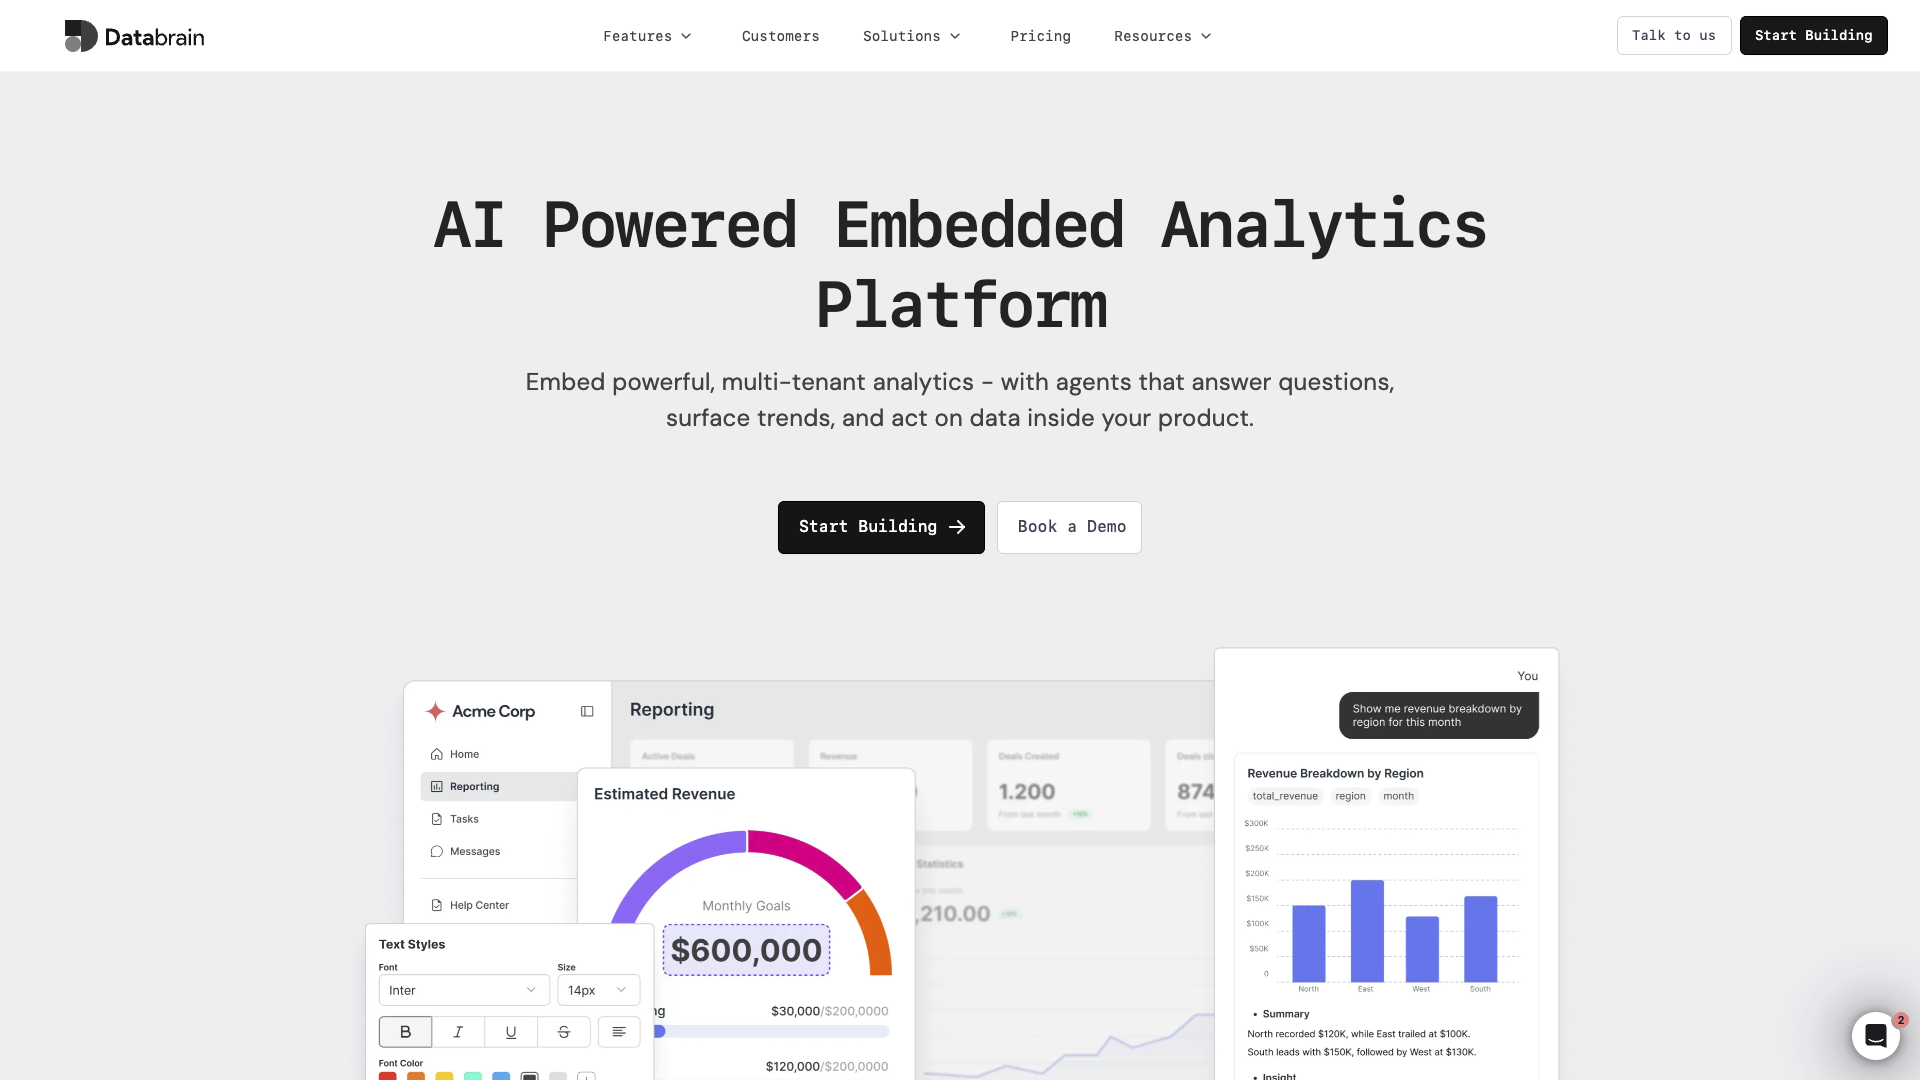
DataBrain: developer-first embedded analytics
DataBrain is purpose-built for SaaS teams embedding analytics in their own product. Multi-tenancy, row-level security, and white-labeling are defaults, not upgrades; the SDK ships a Shadow-DOM web component for React, Angular, Vue, and vanilla hosts; and pricing is published and flat-rate. It maps directly to the Looker triggers above: native (non-iframe) embedding, cloud-agnostic deployment, deep theming, predictable cost, and no LookML modeling project before you ship.
- Best for: SaaS teams whose customers (not internal analysts) consume the analytics surface, and teams that want governed metrics without a months-long LookML build or per-seat pricing.
- Where DataBrain wins vs Looker: native component embedding (no iframe), white-label as a default, flat-rate pricing with unlimited viewers instead of platform-fee-plus-per-seat, cloud-agnostic data connections (not GCP/BigQuery-anchored), and faster time-to-value. DataBrain's own pricing page lists the Pro plan explicitly as a "Looker replacement." See the DataBrain vs Looker comparison for the head-to-head.
- Where Looker still wins: a deeper, more mature governed semantic layer (LookML) for large internal analytics practices, and tight native BigQuery/GCP integration.
- Pricing: published flat-rate: Growth $999/month and Pro $1,995/month, both with unlimited seats and embeds (Enterprise custom). See DataBrain's published pricing.
Sisense: complex data models with a developer SDK
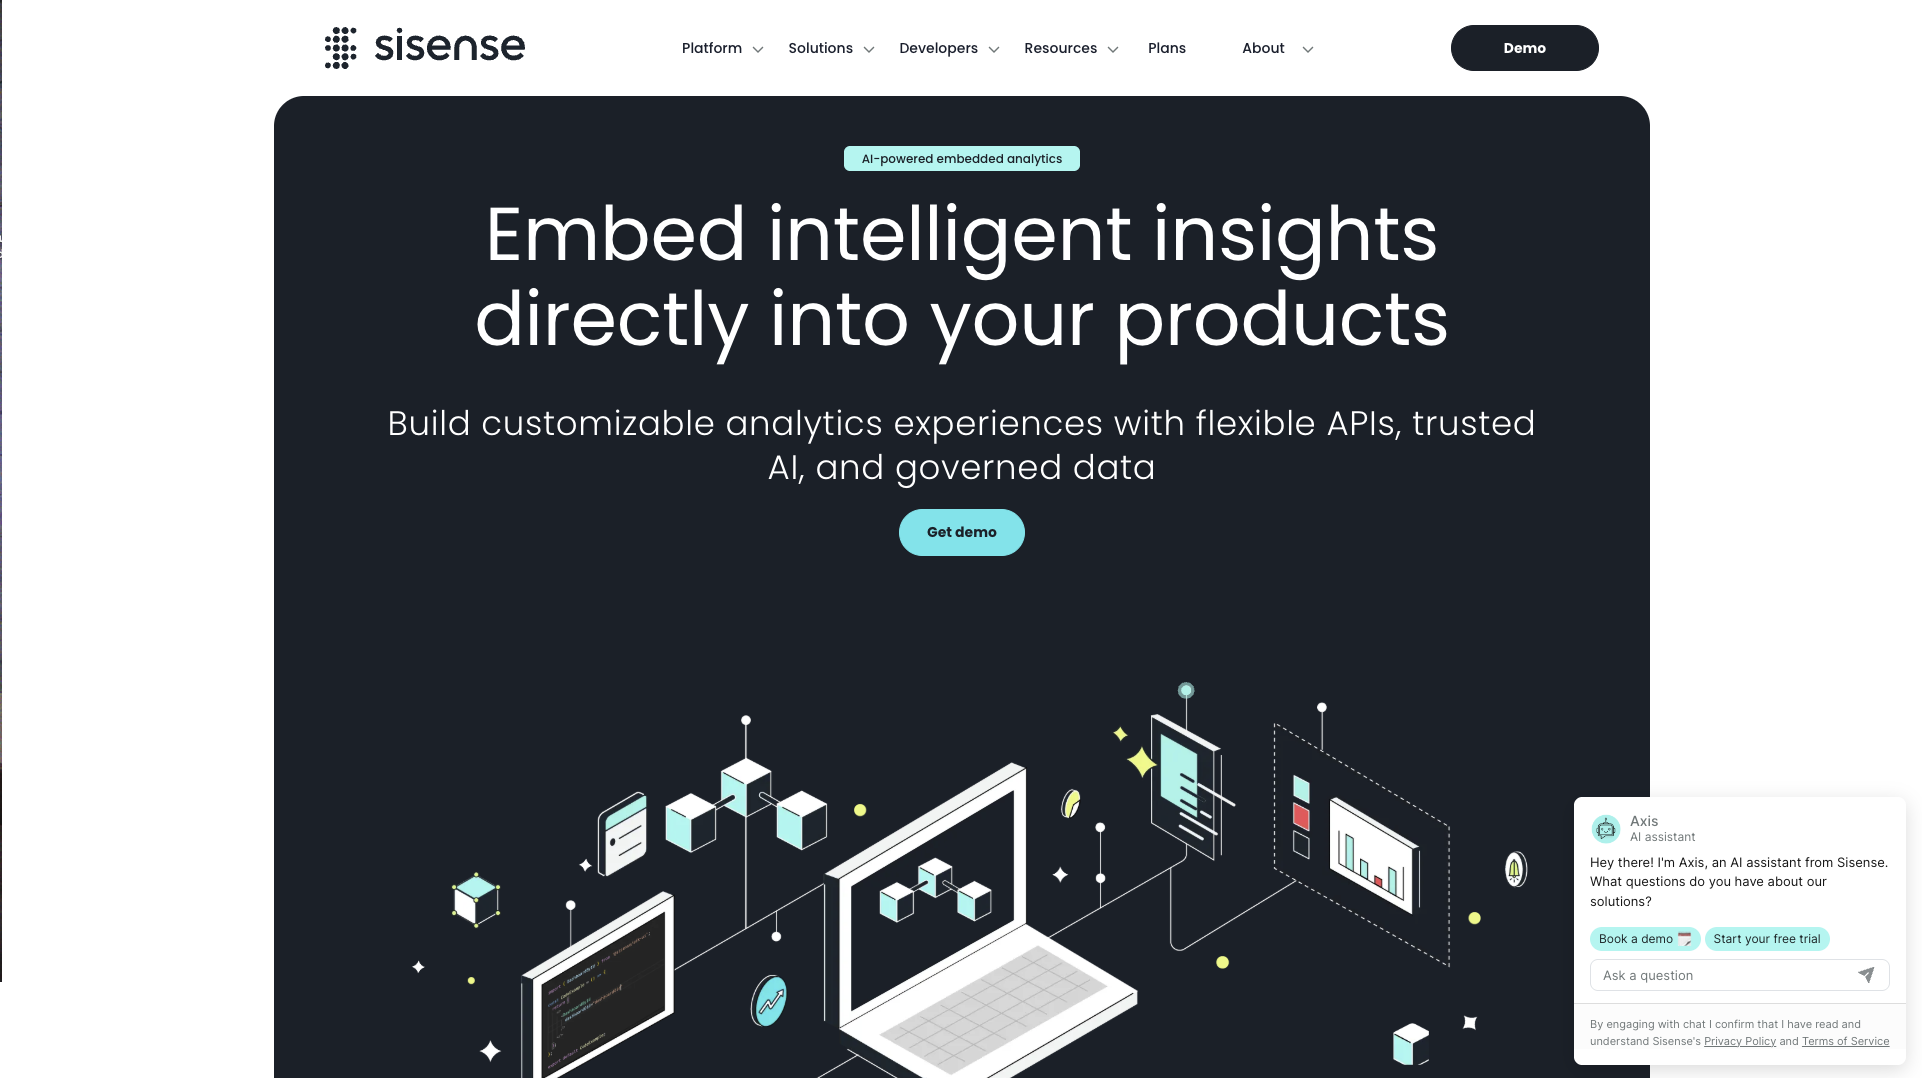
Sisense pairs an analyst-facing platform with the Compose SDK developer track, which is closer to what most SaaS product teams need than its classic analyst tooling. It's the heavyweight option for teams with genuinely complex data preparation and customization needs who still want to move off LookML.
- Best for: teams that want a developer toolkit and enterprise BI for an internal analyst team from one vendor, with deep customization.
- Where Sisense wins vs Looker: a component-based embedding SDK (Compose) without LookML, strong data-modeling for complex pipelines, and cloud-agnostic deployment.
- Where Looker still wins: pricing transparency relative to nothing (both are quote-based), and a more standardized, versioned semantic layer than Sisense's modeling approach.
- Pricing: quote-based; independent 2026 estimates put entry around $21k–$25k/year and enterprise around $137k+/year. See Sisense pricing for the current quote-based breakdown.
Luzmo: fast, white-label embedding for SMB and mid-market

Luzmo (formerly Cumul.io) is built specifically to embed customer-facing dashboards into SaaS products with minimal code. Its Luzmo Flex components, white-labeling, and Luzmo IQ AI layer make it a strong pick for product-driven teams that want to ship branded analytics in days, not a LookML quarter.
- Best for: SMB and mid-market SaaS teams that want fast time-to-market, strong visual branding/white-labeling, and predictable usage-based pricing rather than enterprise BI modeling.
- Where Luzmo wins vs Looker: built-to-embed UX, full white-labeling for a native feel, much faster setup, and public list pricing, with no LookML and no GCP coupling.
- Where Looker still wins: enterprise-scale governance, a deeper semantic layer, and larger high-concurrency deployments.
- Pricing: public tiers (as of 2026) from €495/month (Starter) and €1,995/month (Premium), both billed annually and scaled by Monthly Active Users; Enterprise is custom. AI-assisted dashboarding (Luzmo IQ) is included from the Premium tier; there's no documented MCP support yet.
Cloud & Open-Source BI
Power BI Embedded: Azure-native, predictable capacity
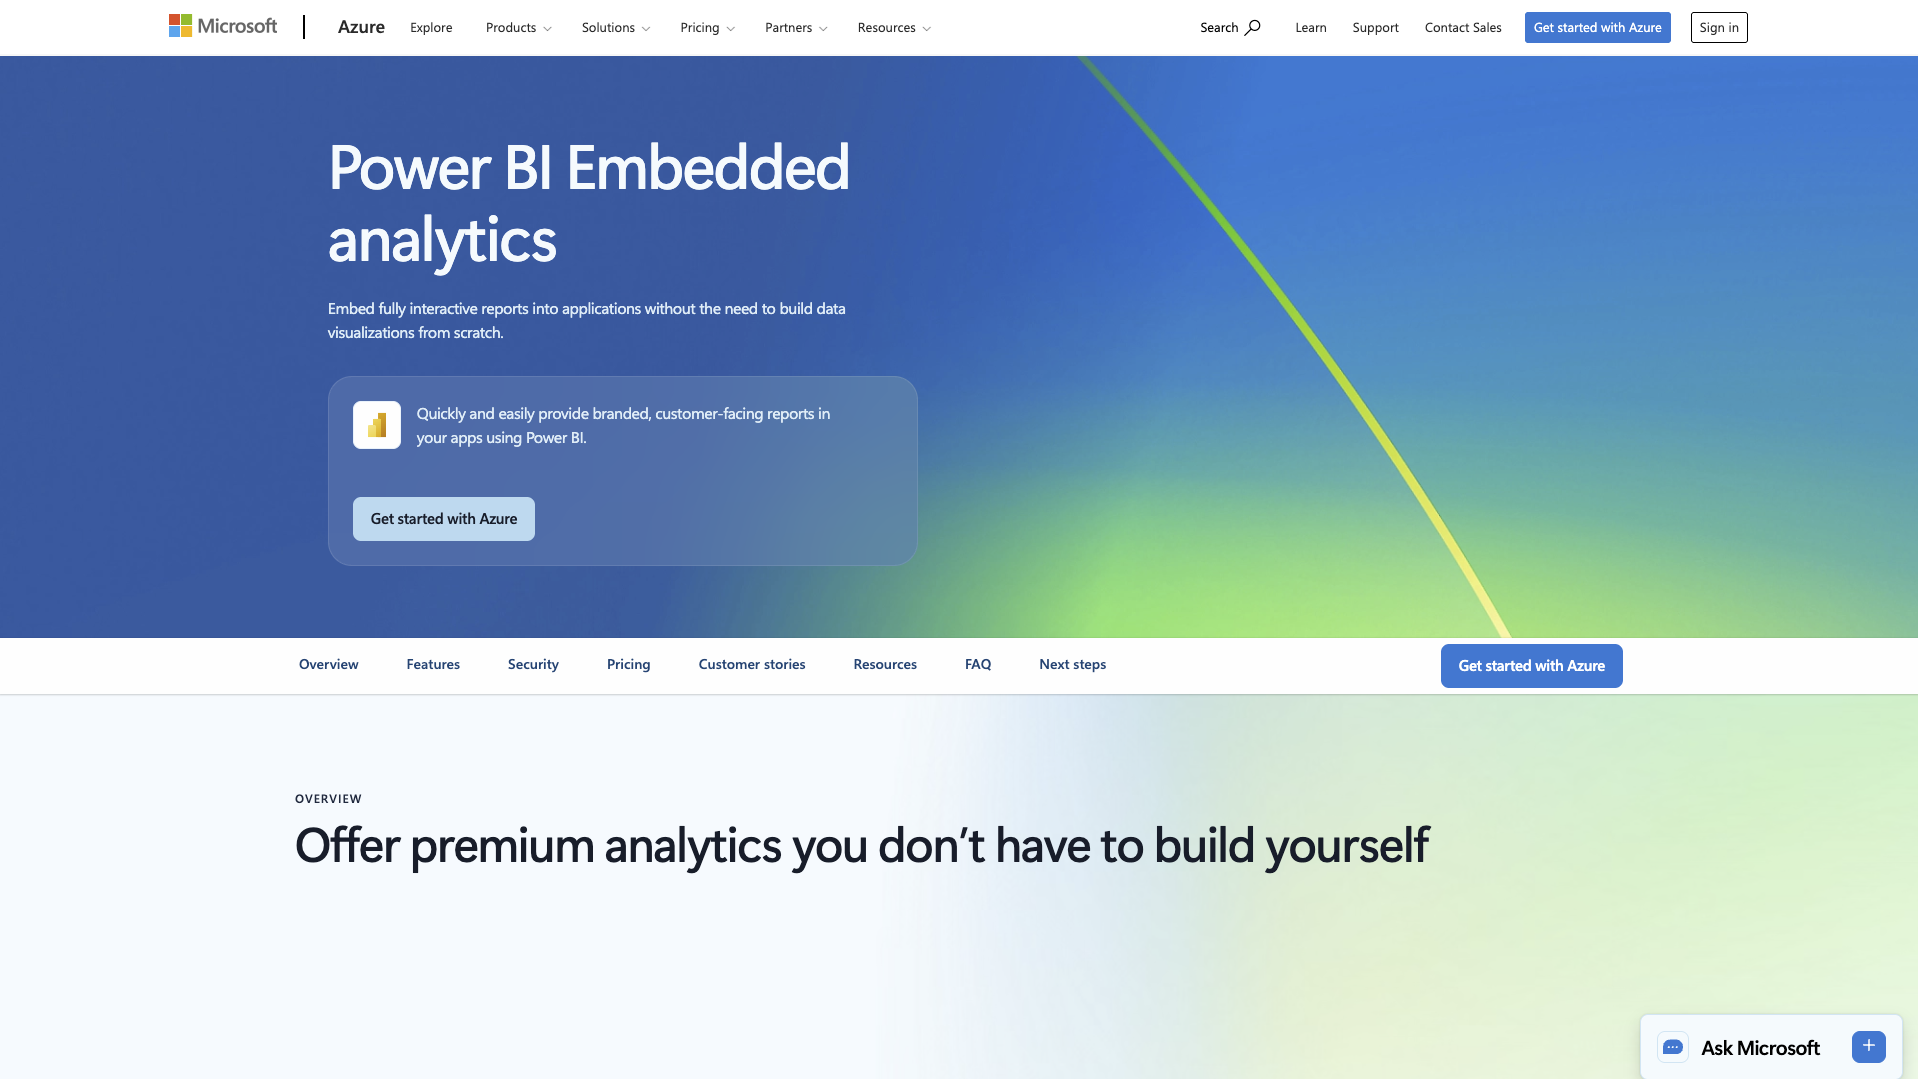
Microsoft's embedded SKU is the natural switch for teams whose stack is already in Azure, Fabric, or Synapse. Its capacity-based pricing is the most predictable in the cloud-BI category, and Copilot brings generative authoring to the Microsoft stack, a credible Looker alternative for Microsoft-centric (rather than Google-centric) organizations.
- Best for: Microsoft-cloud teams that want predictable, capacity-based embedding economics.
- Where Power BI wins vs Looker: published capacity pricing and tight integration across the Microsoft data estate (Fabric semantic models, Azure AD) instead of GCP/BigQuery.
- Where Looker still wins: a more rigorous, code-versioned semantic layer (LookML) and a cleaner multi-cloud data story than an Azure-anchored stack.
- Pricing: capacity-based via Microsoft Fabric F-SKUs (from about $262/month for F2), with legacy A-SKUs still available (A1 about $735/month, A2 about $1,470/month at always-on rates). In app-owns-data embedding, end users don't need per-user licenses; Power BI Pro (report creators) rose to $14/user/month in April 2025. See the full Power BI Embedded pricing and the Power BI Embedded alternatives for SDK-first options.
Tableau Embedded: visualization depth and ecosystem
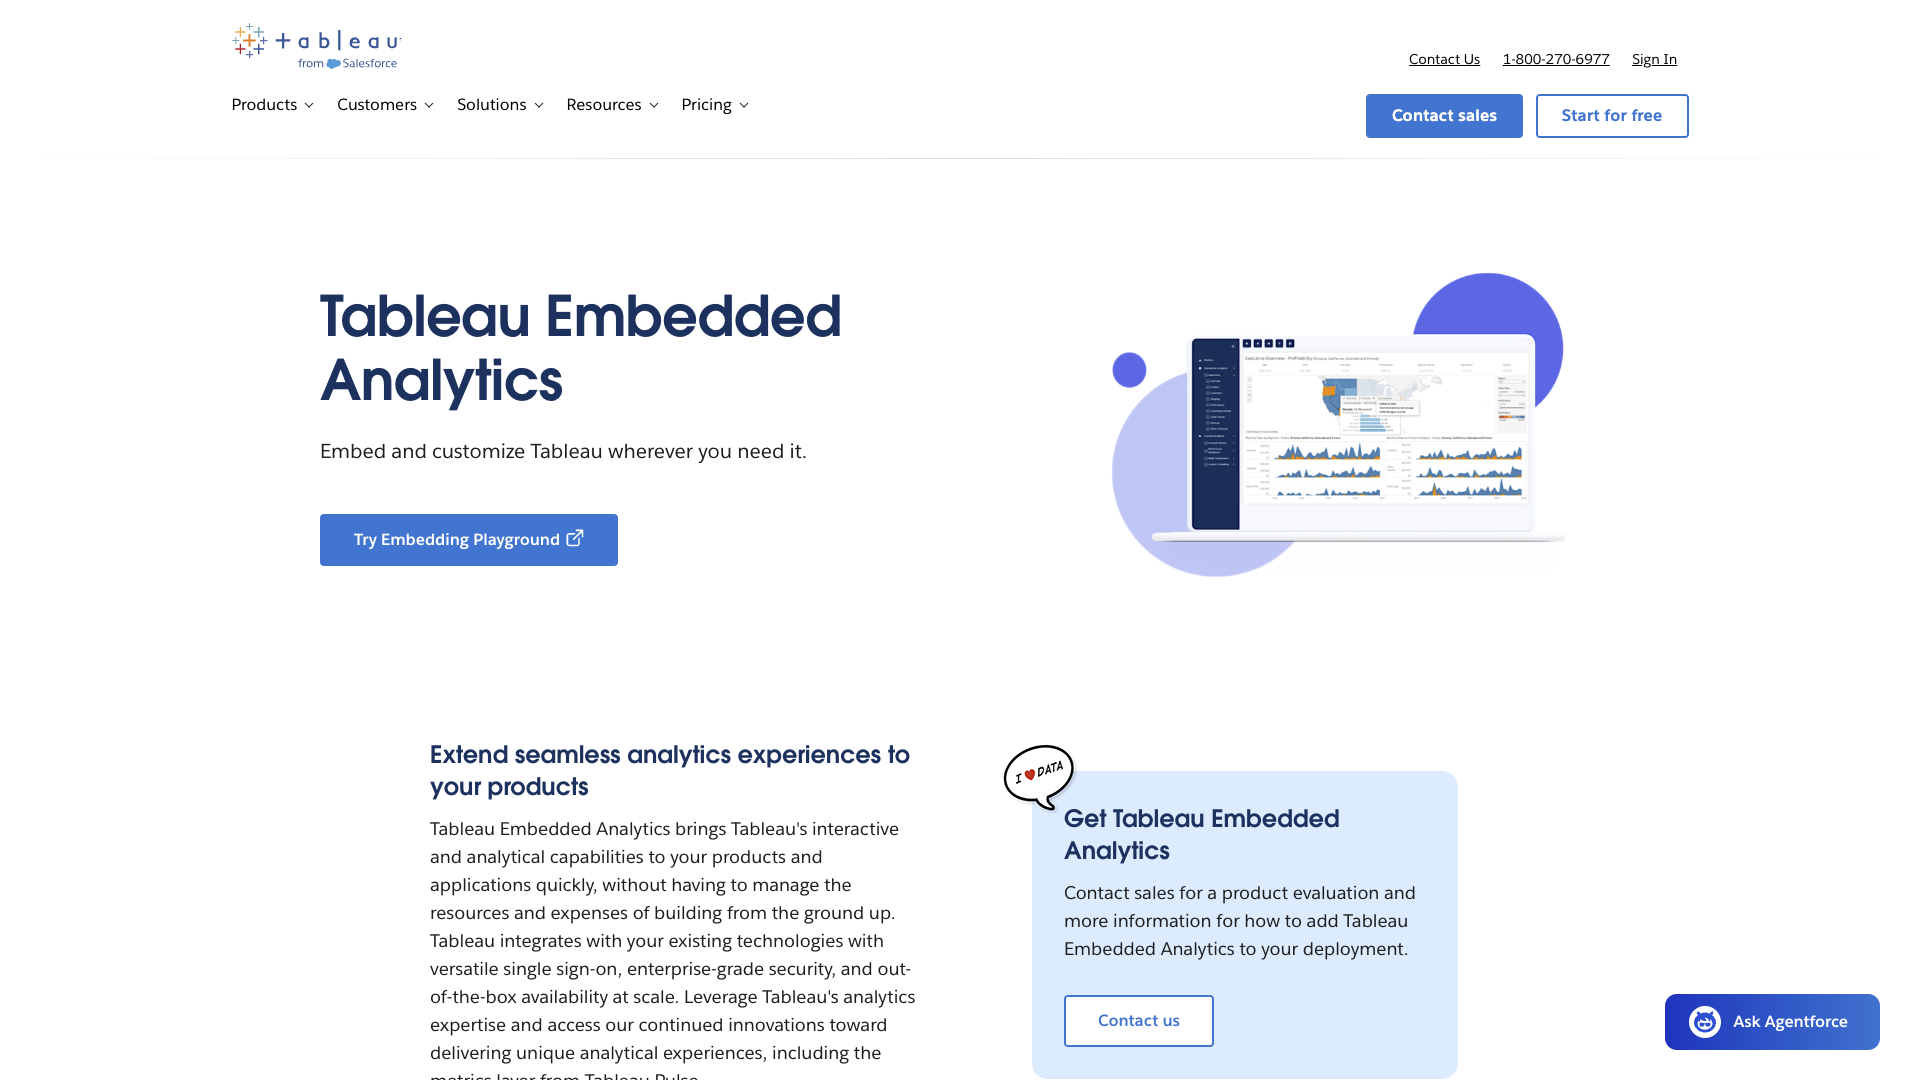
Tableau is the visualization-depth incumbent, with the richest interactive dashboards and a large community. Salesforce's AI layer (Tableau Agent and Pulse) adds assisted analysis and proactive metric monitoring, a strong Looker alternative when visualization richness outranks semantic governance.
- Best for: teams whose buyers expect Tableau-grade visuals, or who already sell into the Salesforce ecosystem.
- Where Tableau wins vs Looker: visualization richness, analyst-tooling maturity, and the modern Embedding API v3 (
<tableau-viz>web component). - Where Looker still wins: a governed, code-versioned metric layer (LookML) versus Tableau's more workbook-centric modeling, and simpler per-environment economics at very large viewer counts.
- Pricing: role-based per-user: Creator about $75/user/month and Viewer about $15/user/month on Standard, higher on Enterprise; embedded use is custom-quoted on top, so budget for viewer scale. See Tableau Embedded pricing and the DataBrain vs Tableau comparison.
Metabase: open-source, low-cost migration target
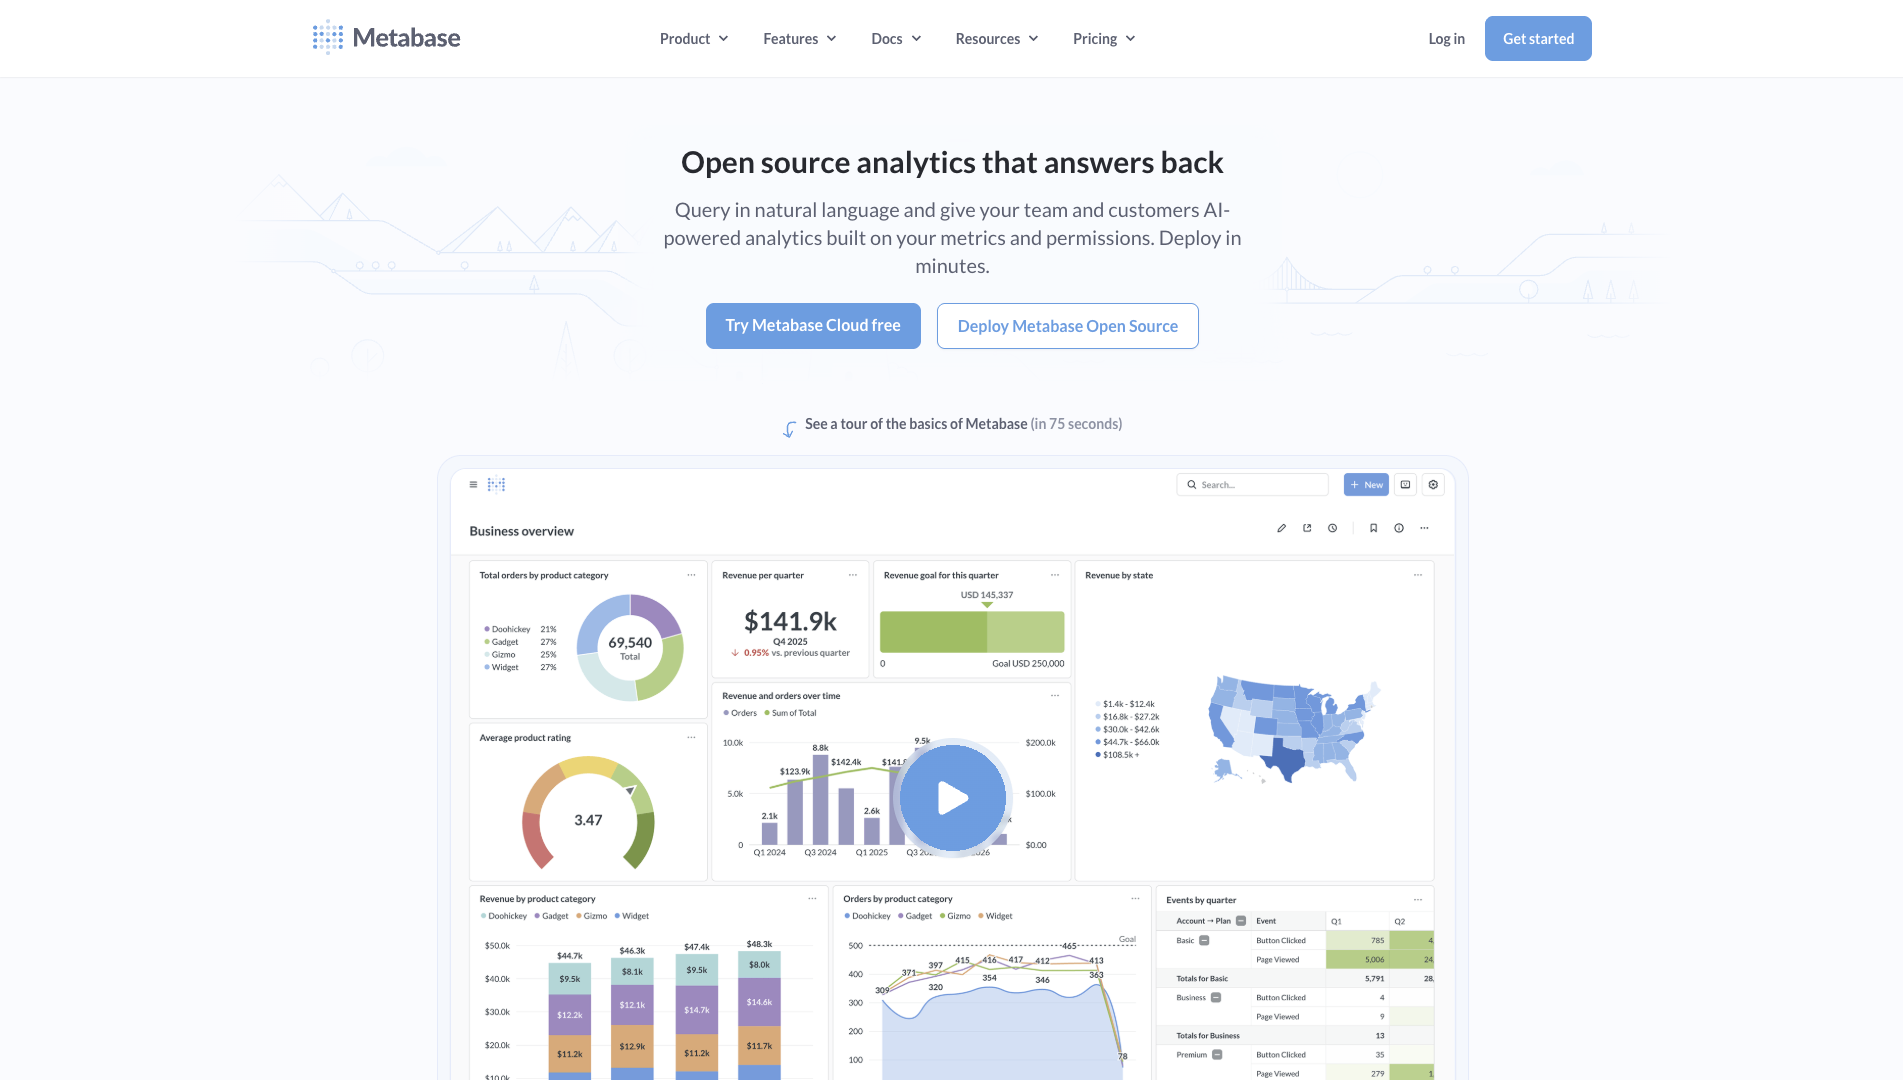
Metabase is the most common low-cost destination for teams leaving Looker on cost grounds. It's open-source and self-hostable for free, SQL-first, fast to stand up, and its paid tiers add interactive embedding, a React SDK, multi-tenant segregation, and white-labeling, all without LookML.
- Best for: cost-sensitive teams that want an open-source, SQL-first BI tool they can embed, and a cheaper alternative to Looker's platform fee.
- Where Metabase wins vs Looker: a free open-source tier, transparent published pricing, far lower entry cost, and no proprietary modeling language to learn.
- Where Looker still wins: a deeper governed semantic layer, enterprise-scale modeling, and richer agentic AI than Metabase's NLQ.
- Pricing (verified 2026): Open Source is free (self-hosted, unlimited users). Cloud Starter is $100/month plus $6/user/month (first 5 users included); Pro is $575/month plus $12/user/month (first 10 included) and adds interactive embedding, the Embedded Analytics SDK for React, row/column-level security, SSO, and white-labeling; Enterprise is custom (from $20,000/year). AI ("ask questions with AI") is included, billed by usage if you use Metabase's AI service rather than your own key.
AI-First & Semantic-Layer
ThoughtSpot: search-driven, agentic analytics at scale
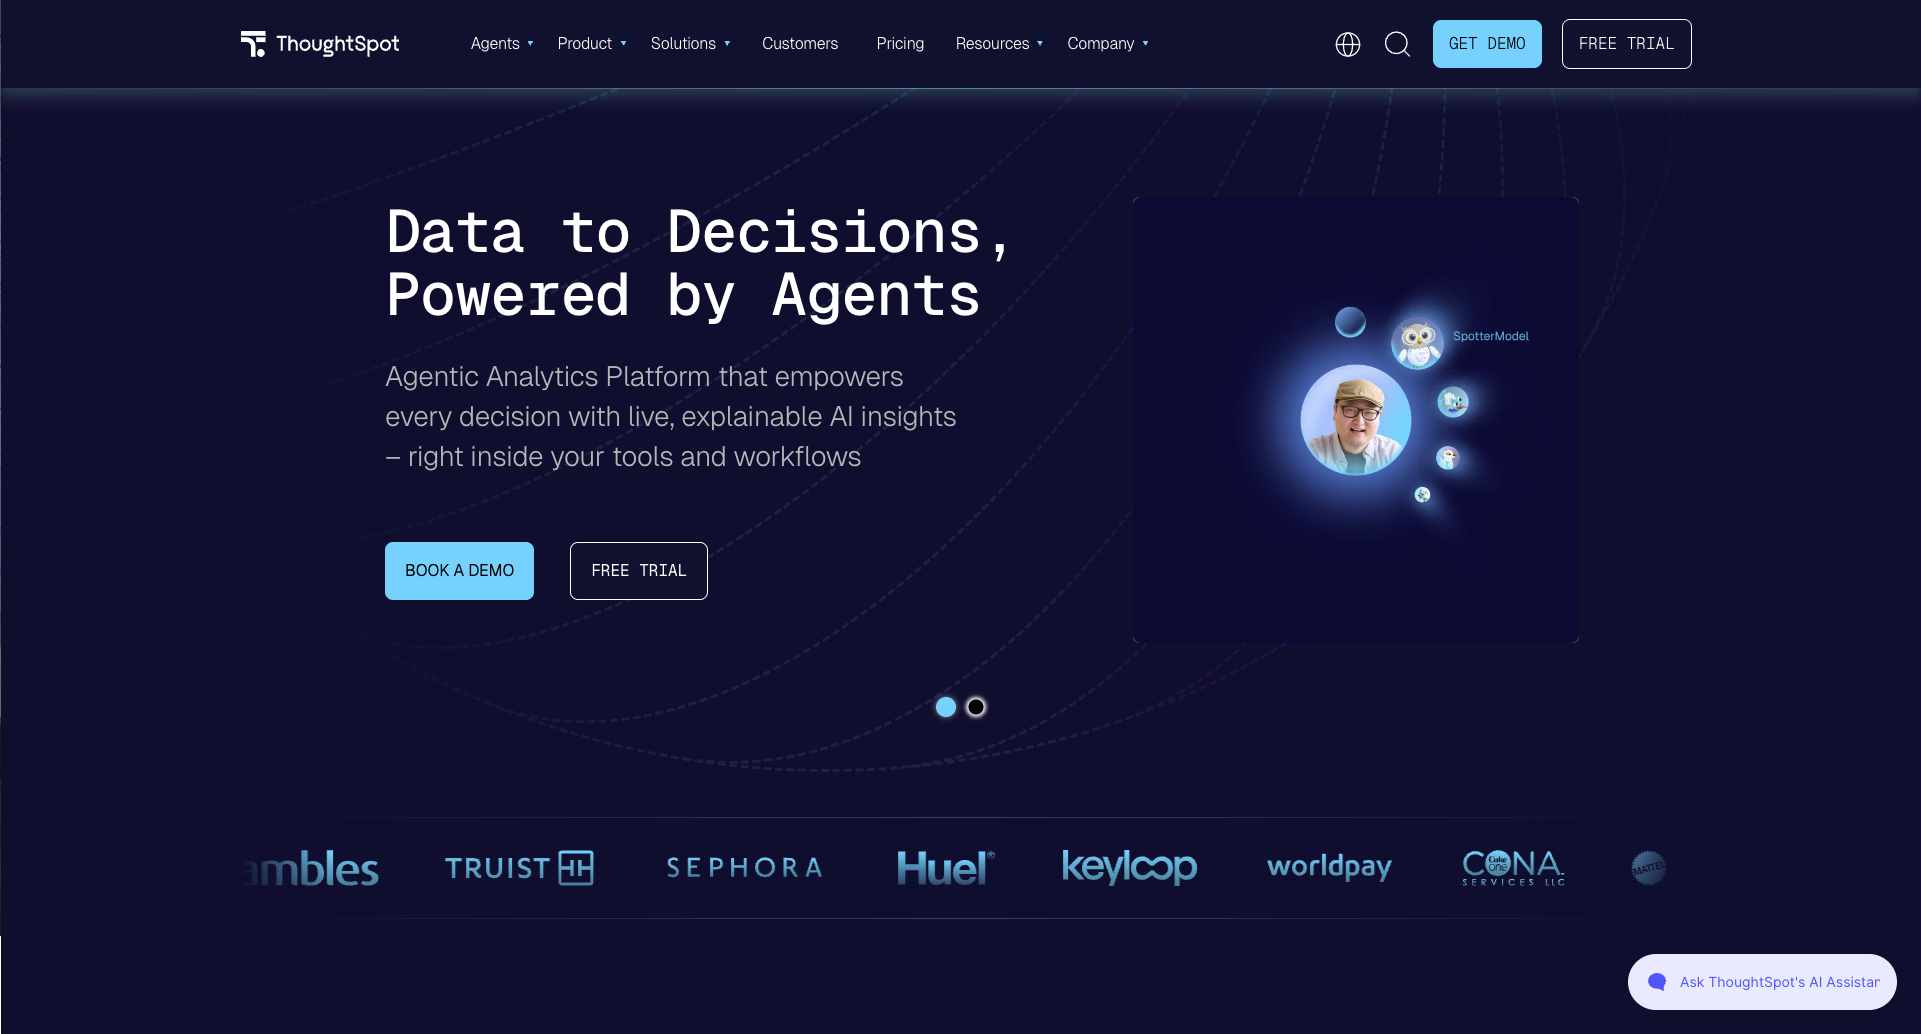
ThoughtSpot is the search-first analytics leader, letting users type or speak questions to surface insights. Its 2026 headline is Spotter, an agentic experience that breaks complex questions into steps and validates intermediate results, a Looker alternative for teams that want AI-led exploration over LookML-led governance.
- Best for: large-scale, search-first analytics where end users expect Google-like querying and agentic exploration.
- Where ThoughtSpot wins vs Looker: agentic reasoning depth and a search paradigm built for non-analysts at enterprise data volumes.
- Where Looker still wins: lower learning curve for governed metric consistency, and tighter native BigQuery integration; search analytics needs user enablement.
- Pricing: quote-based for Pro and Enterprise. ThoughtSpot's published tiers have shifted away from the old per-user list toward plan-based and custom pricing. Third-party procurement data (Vendr) shows a median annual contract around $92k (range ~$37k–$231k across ~30 deals), and embedded use is consumption-style. Weigh that against flat-rate options before committing at scale.
GoodData.AI: governed per-workspace embedding with AI agents
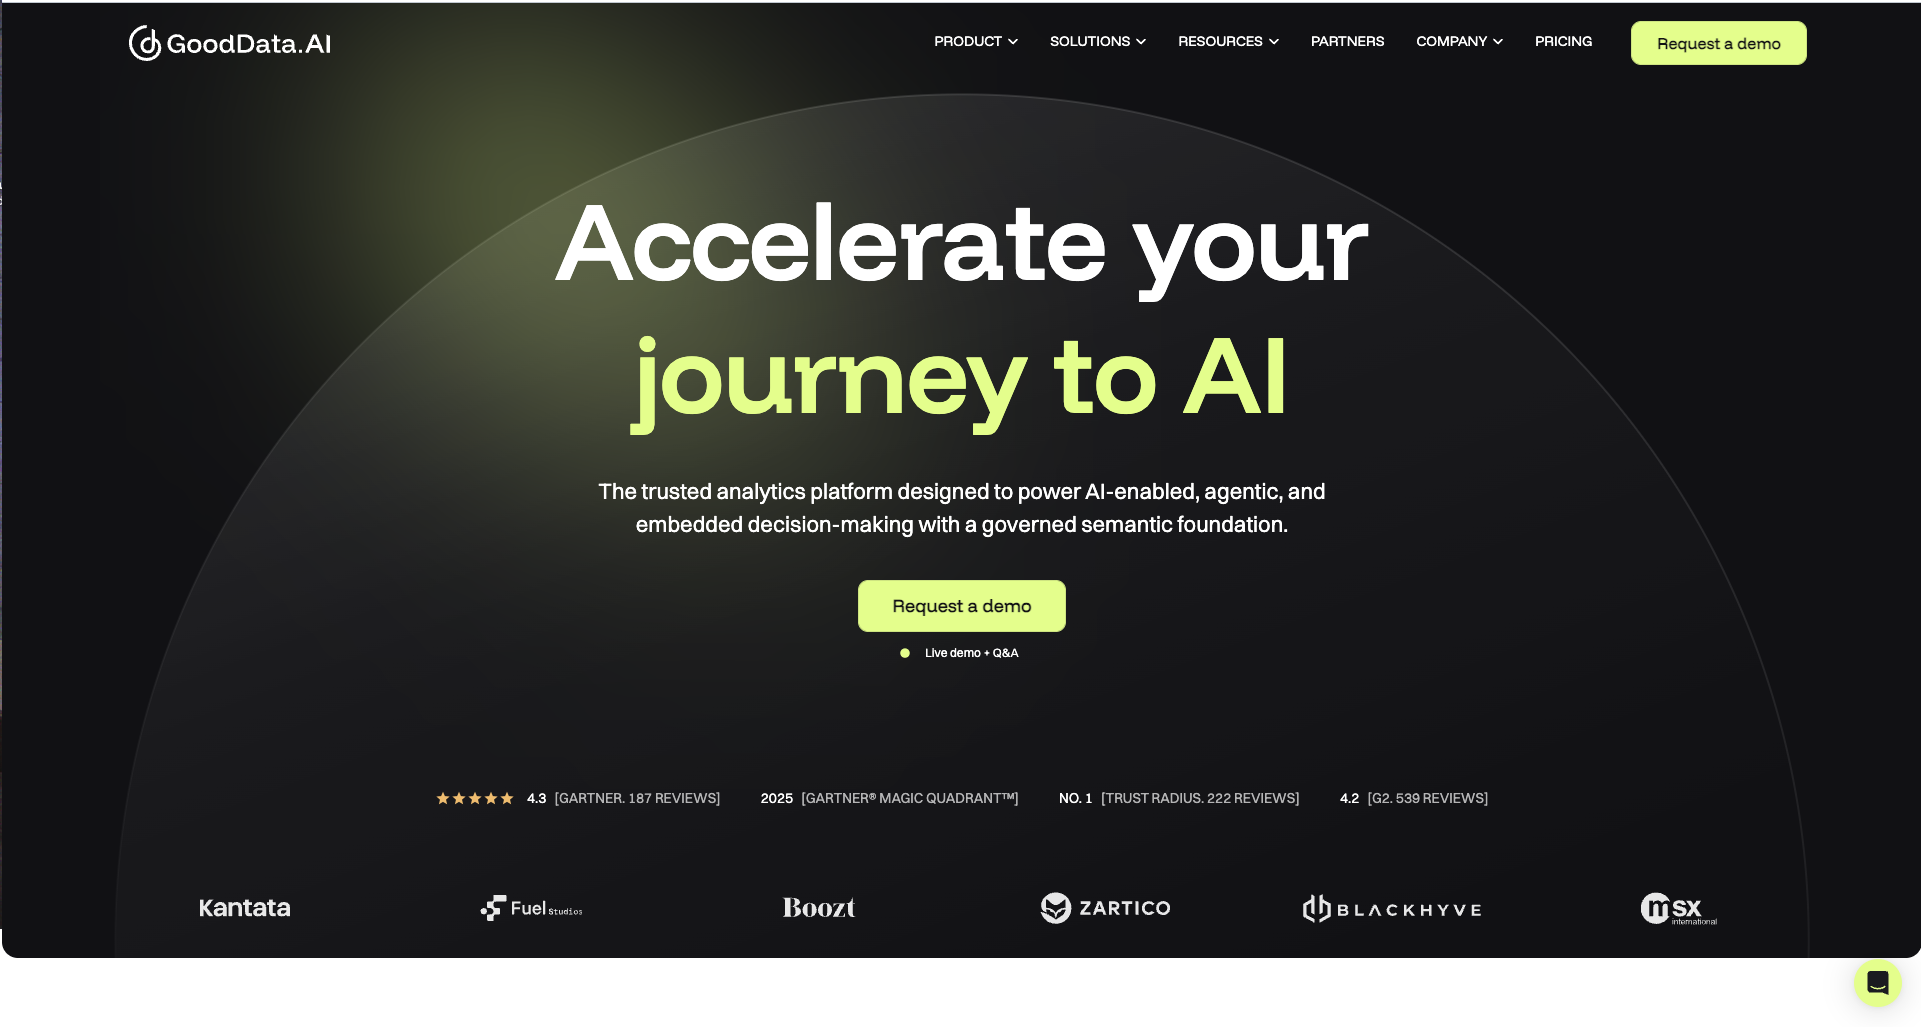
GoodData (platform now branded GoodData.AI) is the closest "keep Looker's governed semantic layer, lose the GCP coupling" alternative. It's an embedded, multi-tenant platform built around a governed semantic model and a per-workspace architecture, and its 2026 push adds an MCP server and an Agent Builder for custom analytics agents.
- Best for: SaaS teams that want Looker-style governed, reusable metrics with per-workspace multi-tenant embedding, without committing to LookML or Google Cloud.
- Where GoodData wins vs Looker: a governed semantic layer that isn't tied to GCP/BigQuery, per-workspace tenant isolation, and an MCP-native AI roadmap.
- Where Looker still wins: ecosystem maturity and native BigQuery performance; both require up-front semantic-layer work, so neither is "fast to ship."
- Pricing: no public list price (sales-led, custom-quote); the stated model is per-workspace (a platform fee plus the number of workspaces), and independent 2026 analyses put year-one deployments roughly $60k–$250k depending on tenant count and AI usage. Budget for the post-rebrand per-workspace model on a custom quote rather than a published rate.
Build vs Embed: How to Choose
Before "which Looker alternative," many teams should answer "build, buy a standalone BI tool, or embed." Here's the honest framework.
For SaaS companies whose analytics layer enables the product (rather than is the product), embedded analytics is almost always the right shape. The internal debate becomes which embedded vendor fits, which is what the categories above cover.
Builder reader (SaaS PM / engineer)
If you're leaving Looker because LookML modeling, the iframe embed, per-seat cost, or GCP coupling doesn't fit your customer-facing product, the embedded-native category (DataBrain, Sisense Compose, Luzmo) is where the technical fit is closest. Validate native embedding, multi-tenant provisioning, and how each vendor handles row-level security before you commit.
Analyst reader (BI / data team buyer)
If the use case is internal analytics and the question is "what replaces Looker for our team," the cloud & open-source BI category (Power BI, Tableau, Metabase) is where you'll spend most of your evaluation. Match it to your cloud (Azure, multi-cloud, or self-hosted) and your governance needs. If a governed semantic layer is non-negotiable, weigh GoodData.AI as the cloud-agnostic semantic alternative.
2026 Freshness: Looker's Agentic Turn and the MCP Question
The biggest 2026 change in this category is that Looker itself went agentic. At Google Cloud Next '26, Google detailed a wave of Looker AI updates, and the key facts an evaluator needs are about lifecycle stage, not marketing:
- Gemini in Looker is GA (enabled at the instance level). Within it, the Visualization Assistant is GA, while the Expression Assistant and Insight Assistant are in preview.
- Conversational Analytics in Looker is GA, including the core Conversational Analytics agent (GA) and Embedded Conversational Experiences (GA); Dashboard Agents and the Conversational Analytics API are still preview / pre-GA.
- Looker's MCP support is in preview. Looker supports the open-source Model Context Protocol via the MCP Toolbox for Databases, and Google announced a managed Looker MCP server native to Looker (grouped under "Open BI and MCP (Preview)").
That makes "how good is the AI, what's GA, and how is it priced" a core 2026 evaluation axis. The table below compares the headline AI and embedding posture across Looker and the alternatives:
The takeaway: Looker is no longer the "no AI" option. It's competitive on GA conversational analytics and has a real MCP roadmap. So in 2026 the Looker-vs-alternative decision turns back on the durable axes (embedding model, semantic-layer effort, cloud coupling, and cost shape), not on whether a vendor has any AI. For a deeper, AI-axis-first comparison of these vendors on agentic depth and semantic-layer accuracy, see best AI-first embedded analytics.
Where to Go Next
- Compare head-to-head: see DataBrain and Looker compared for native embedding, LookML-free semantic modeling, multi-tenancy, and pricing side by side.
- Cost the alternatives: revisit the pricing breakdowns linked in each vendor section above for the cloud-BI, open-source, and per-workspace options.
- Widen the shortlist: if your evaluation is going beyond Looker, scan the Metabase alternatives for the open-source angle.
- See it embedded: book a live, white-label embed walkthrough if a customer-facing analytics surface is on your roadmap.
Frequently Asked Questions
What is the best Looker alternative for embedded analytics?
For customer-facing SaaS embedding specifically, the embedded-native category fits best: DataBrain for native (non-iframe) component embedding with white-label and flat-rate pricing, Sisense Compose for complex data models, and Luzmo for fast SMB/mid-market white-label dashboards. If you're on the Microsoft stack, Power BI Embedded fits; for a governed semantic layer without GCP coupling, GoodData.AI is closest; for the lowest cost, open-source Metabase is the common migration target.
Are there free or open-source Looker alternatives?
Yes. Metabase is the most common open-source, self-hostable Looker alternative, free on its open-source tier and the usual low-cost migration target, with paid tiers adding interactive embedding and a React SDK. Apache Superset and Lightdash are other open-source options; Lightdash reads dbt models as a LookML-style semantic layer. The trade-off is that you self-host and maintain it, and governed semantic depth is lighter than Looker's LookML.
How much does Looker cost in 2026?
Looker is quote-based. Google publishes no public list price. The most-cited 2026 anchor is Vendr's procurement average of ~$150,000/year across 355 deals. Smaller Standard deployments land nearer ~$36k–$60k/year, while embedded and enterprise deployments rise into the six figures. Marketplace listings suggest per-user add-ons around ~$400 (viewer), ~$799 (standard), and ~$1,665 (developer) per year on top of the platform fee. Treat every figure as an independent estimate, not official Google pricing.
Does Looker support multi-tenant embedded analytics, RLS, and white-labeling?
Yes, with caveats. Looker embeds via signed iframes (or its JS Embed SDK), enforces row-level security through LookML access_filters tied to user attributes, and supports multi-tenant isolation. But deep white-labeling needs the Embed/Elite edition, and the iframe is DOM-isolated, so your app's CSS can't style inside it. Embedded-native tools like DataBrain ship multi-tenancy, RLS, and white-labeling as defaults through a native component.
How does DataBrain compare to Looker?
DataBrain embeds as a native component in your app's DOM (no iframe), ships multi-tenancy, row-level security, and white-labeling as defaults, prices flat-rate with unlimited viewers, and connects to your warehouse regardless of cloud, with no LookML modeling project before you ship. DataBrain's own pricing page lists its Pro plan as a "Looker replacement." Looker wins on the depth of its governed semantic layer (LookML) and native BigQuery integration. The DataBrain vs Looker comparison linked above covers the head-to-head detail.


